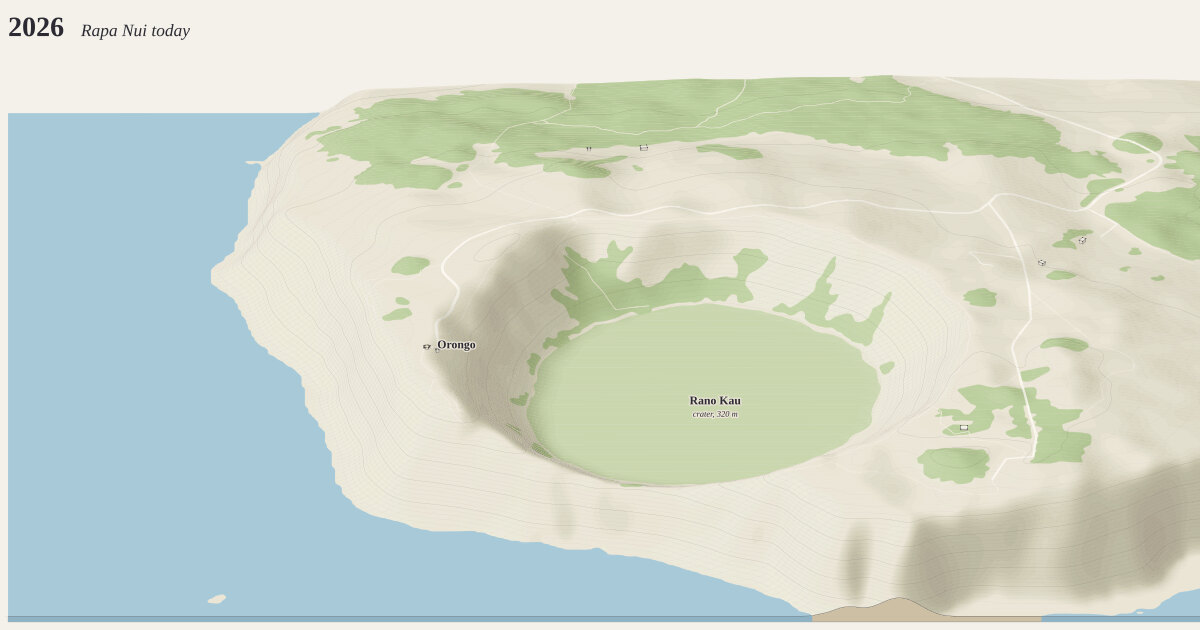
Rapa Nui (Easter Island) — Rano Kau and Orongo, 2026. A frame 3.8 km across and 3 km deep (11.40 km²), centered on 27.1830°S, 109.4370°W.
The year 2026: Rapa Nui today how time is drawn →
Open data only: OpenStreetMap and Copernicus GLO-30.
Measured: 10 buildings standing today that had been built by 2026. 10 more have no recorded year and appear only in today’s scene. Anything demolished since is missing unless traced or curated below.
Curated for this year, from published sources; positions are drawn from today’s street grid and published dimensions, not surveyed:
- Hanga Roa (1000–9999). Position from OpenStreetMap. [1]
- Rano Kau (1000–9999). Position from OpenStreetMap. [1]
- Orongo (1000–9999). Position from OpenStreetMap. [1]
- Ahu Tahai (1000–9999). Position from OpenStreetMap. [1]
- Ahu Vinapu (1000–9999). Position from OpenStreetMap. [1]
- Puna Pau (1000–9999). Position from OpenStreetMap. [1]
- Ahu Akivi (1000–9999). Position from OpenStreetMap. [1]
- Terevaka (1000–9999). Position from OpenStreetMap. [1]
- Anakena (1000–9999). Position from OpenStreetMap. [1]
- Rano Raraku (1000–9999). Position from OpenStreetMap. [1]
- Ahu Tongariki (1000–9999). Position from OpenStreetMap. [1]
- Poike (1000–9999). Position from OpenStreetMap. [1]
The ground is today’s: cuts and fills since (the interstate, the floodwall) are in the elevation.
Camera how the camera works →
Looking north (bearing 0°), a fixed bearing with no snapping. Orthographic, tilted 30° down from the horizon: ground running into the picture is drawn at 0.5× its length and heights at 0.87×. 1 px per meter across the frame; the whole drawing is 3,848 × 1,879 px at 1:1.
Sources where the data comes from →
- OpenStreetMap: 6,442 features read from the cached download, shared with region
rapa-nui; the sea and tidal water come from 131 coastline ways. - Copernicus DEM GLO-30 elevation (Worldwide (European Space Agency, Copernicus program); a 30 m surface model from the TanDEM-X radar mission: it includes forest canopy and buildings, so it suits mountains better than cities), fetched at 30 m per pixel and resampled to a 10 m grid. The ground runs from 0.0 m to 322.0 m above sea level (322.0 m of relief), drawn 1× taller than life. Buildings and bridges keep their true heights.
Ground what the ground is made of →
From the map, 48 mapped areas of water, islands, parks, woods and other cover, and 30 ribbons of road, path, rail, canal and weir. Painted in 150 strips from back to front, 20 m deep each, so hills hide what is behind them (why). Contours every 10 m with every 5th line heavier: 33,407 segments.
Rivers and rapids how rapids are read →
No stretch of water read as rapids: places on a river where its surface, recovered from the lidar, falls faster than 0 m per km along its channel, measured over 200 m. Rock standing more than 1 m clear of the water around it is drawn as boulders; lakes, basins and the sea get neither. Both are inferred from the lidar, not observed.
Buildings where heights come from →
10 buildings, extruded from footprints of at least 12 m² that lie wholly inside the frame, from OpenStreetMap.
- 0 (0%) from a
heighttag - 2 (20%) from the number of floors, at 3.4 m a floor
- 8 (80%) guessed from the building’s type and size
Bridges how decks are placed →
No bridges in the frame.
Drawing paint order →
The paper palette, dots on roof corners only, on a ground slab 20 m thick.
This build the archive →
Built November 19, 2026 in 2.9 s, 3.13 MB of SVG. From commit 47bccf5, “Tutorial 1: map any place from open data with an AI chat, using Rapa Nui (Easter Island)”.
Other measures: datedFromParcels 0, footprintsDrawn 0, labels 2, streetcarLines 0, streetcars 0.
Map data © OpenStreetMap contributors (ODbL) · Elevation: produced using Copernicus WorldDEM-30 © DLR e.V. 2010-2014 and © Airbus Defence and Space GmbH 2014-2018 provided under COPERNICUS by the European Union and ESA; all rights reserved (Licence for the use of the Copernicus WorldDEM-30 (free, worldwide, commercial use allowed)) · credits and licenses