How it's made
isoscape draws a real place as an isometric dot-and-line picture: inked edges, a dot on every visible corner, flat fills. Nothing in it is drawn by hand. Every line comes from two open datasets, OpenStreetMap and the USGS 3D Elevation Program, and the code decides where it goes.
This page follows the pipeline from the download to the finished SVG. It also says, for every part of the picture, whether it was measured, inferred from a measurement, or guessed. They look the same on the page, and they are not.
Each build in the explorer also has its own How this view was made tab under the picture. It gives that view's frame, sources and counts, and links back to the sections here.
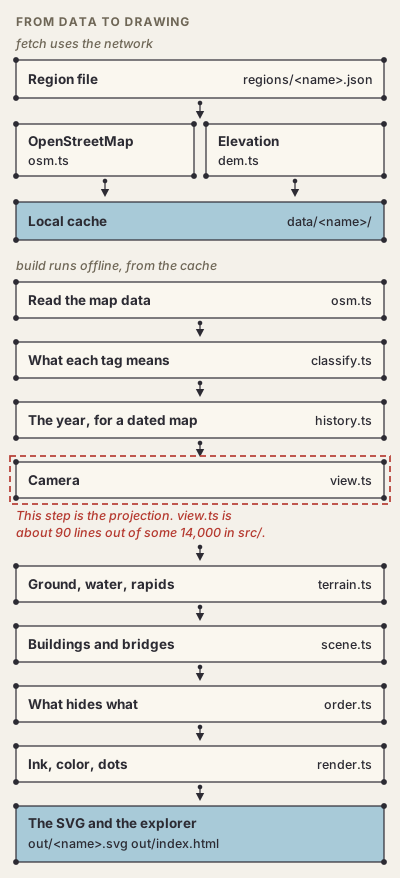
Where to start:
- Lidar and GIS: Terrain, Rivers, Rapids and Shoreline.
- Urban planning: Buildings, Bridges and Measured, inferred, guessed.
- Art and illustration: Camera, Drawing and Paint order.
- History: Time covers the dated series: what is measured, what is curated, and what a series cannot show.
- Development: every section names the file that does the work. The archive and explorer section covers the build loop.
Measured, inferred, guessed
| Part of the picture | Comes from | How sure |
|---|---|---|
| Building footprints, roads, rail, parks, water outlines | OpenStreetMap | Mapped by volunteers, mostly traced from aerial imagery. Usually good, sometimes stale |
| Extra footprints (where a region asks) | Microsoft's ML building footprints | Traced by a model from imagery. Good outlines, sometimes merged or missing |
| Building heights | OSM height, else Microsoft's model, else building:levels, else a guess | Mixed. In downtown Richmond about 40% are guesses; around Gwynn's Island, a little over half. Each build reports its own split |
| Woods, wetlands, fields, crops (where a region asks) | USGS National Land Cover Database (NLCD 2021) | Classified from satellite imagery at 30 m. Right in the large, coarse at the edges |
| Ground elevation | USGS 3DEP bare-earth model in the US; elsewhere a national or global model (IGN, swisstopo, GSI, Copernicus, Terrain Tiles) | Measured. 1 m lidar where 3DEP has flown; from 1 m to 30 m abroad, by source |
| River surface | The lowest lidar returns over mapped water, smoothed | Inferred |
| Exposed rock and rapids | Height above, and fall of, that surface | Inferred |
| Shoreline (with terrain) | Mapped water, corrected against the lidar | Inferred |
| Bridge deck heights | A per-region rule by name, else a default per OSM layer | Rule of thumb |
| Camera bearing | Snapped to the street grid, or set in the region | Chosen |
Inputs
OpenStreetMap. fetch asks the Overpass API for everything the renderer can draw:
buildings and building parts, water and waterways, roads, railways, parks, woods and other
land cover, islands, coastline and car parks. Large areas are fetched in tiles of at most
1.6 km a side, because Overpass refuses or times out on big requests. Four public mirrors are
tried in turn. Each tile is cached as it arrives, so an interrupted fetch picks up where it
stopped. The merged answer is saved as data/<region>/osm.json.
Elevation. In the US, the ground comes from the USGS 3D Elevation Program
(3DEP), the default source. Its seamless bare-earth model is served by
the National Map's exportImage service, which returns the best data available for each
place: 1 m lidar where it has been flown, coarser models elsewhere. Bare earth means
buildings and trees have been removed. isoscape requests uncompressed 32-bit float GeoTIFFs
in tiles of at most 1,500 pixels a side, at 1 m per pixel unless the region sets
demResolution. The tiles are stitched together and stored as data/<region>/dem.bin.gz:
gzipped 16-bit integers in centimeters, so heights are kept to the nearest centimeter.
The service keeps its pixels square in degrees. A tile sized in meters is not square in degrees away from the equator, so the service widens it north and south about its center and fills the same number of pixels: the image covers more ground than was asked for. Each tile is read on the box it really covers and resampled onto the box asked for. Until November 2026 this was missed, and the ground in every 3DEP map sat squeezed north–south by the cosine of the latitude (0.79 in Richmond, 0.73 at Crater Lake): up to a few hundred meters off at a tile's edge, with a step where two tiles met. Water outlines then lay on banks and cliffs, which read as rock and as false falls. Files fetched before the fix are put right as they load.
Outside the US, a region names another source in terrain.source; isoscape sources lists
them with their credits and licenses, and Landmarks around the world
shows one map for each. ign (France, 1 m) is cut to order like 3DEP, by IGN's WMS server,
as raw 32-bit heights. The rest are published in fixed pieces that isoscape downloads and
resamples onto its own grid. swisstopo (Switzerland, 2 m) comes as one-kilometer squares in
the Swiss grid, found through swisstopo's STAC catalog and converted with swisstopo's
published formulas, good to about a meter. gsi (Japan) comes as web-map tiles with heights
packed into their colors: 5 m lidar first, then 5 m photogrammetry, then the 10 m national
model. copernicus (worldwide, 30 m) comes as one-degree squares of cloud-optimized GeoTIFF,
read with Deflate and the floating-point predictor. terrain-tiles (worldwide) is a mosaic
of open models in web-map tiles. Copernicus is a surface model, so forest and roofs are in
its heights. terrain.fillFrom names a second source for whatever the first leaves empty,
which is how the Matterhorn's Italian face is filled from Copernicus. The default
demResolution is 1 m, or the source's own spacing where that is coarser (30 m for
Copernicus and Terrain Tiles). The cache records which source it came from.
3DEP sometimes fills a gap in its coverage with a large negative number. One patch near Shockoe Bottom reads −88 m. Any sample below −5 m is treated as missing, along with a three-pixel rim around it, and filled from its neighbors.
The download covers the frame's circumscribed circle plus a 60 m margin. The camera can turn after the data arrives (see Camera), and the data still covers the frame. Builds never touch the network, so a build can be repeated exactly.
Building footprints, beyond OSM. OSM is thorough in cities and thin in the country.
Around Gwynn's Island it maps 417 buildings, while Microsoft's
Global ML Building Footprints
find over 6,000. A region can list "microsoft" in sources.buildings. fetch then
downloads the dataset's parts for the region's zoom-9 quadkeys, keeps the footprints whose
centers fall in the region, and stores them in data/<region>/footprints.json. The model
estimates a height for many of them, and that height is kept.
Land cover. Rural OSM rarely maps woods and fields. A region with sources.landcover: "nlcd" gets the National Land Cover Database (NLCD 2021) through
the MRLC's map service. That's a 30 m classification of the whole country: forest, wetland,
pasture, crops, scrub and so on. The map image comes back with each class in its legend
color, and each color is matched back to its class. The result is stored in
data/<region>/landcover.bin.gz.
Code: src/osm.ts, src/dem.ts, src/dem-sources.ts, src/rasters.ts, src/footprints.ts, src/landcover.ts.
Region
A place is one JSON file in regions/. It sets the center (longitude, latitude), the frame's
width and depth in meters, the camera's bearing and whether it may snap, the scale in pixels
per meter, the tilt, the terrain settings, rules for bridge decks, and the palette. The
README's "Region config" section lists every key.
Positions are converted to local meters east and north of the center. This simple equirectangular approximation is accurate to a fraction of a meter across a city-sized frame.
Code: src/region.ts.
Camera
The camera is orthographic: no perspective, so a building is the same size near and far,
and lengths across the picture can be measured with a ruler. It looks down at a fixed tilt.
The region sets squash, the sine of that tilt:
- Ground across the picture is drawn at full scale (
scalepixels per meter). - Ground running into the picture is drawn at
squashof its length. At 0.5 the tilt is 30°, the classic 2:1 view of isometric games. - Heights are drawn at the cosine of the tilt (0.87 at 30°), times any
exaggeration.
The frame is a rectangle on the ground, square to the camera, so it lands on the screen as a plain rectangle. That suits a panorama.
Snap. Seen from due north, most street grids sit at an awkward angle. With snap on,
isoscape measures the dominant direction of every building edge in the frame (weighted by
length, folded so that edges at 0°, 90°, 180° and 270° all count for the same grid). The camera
then turns by up to 45° to put that grid on the picture's diagonals. Downtown Richmond snaps to
a bearing of −8.7°. Set "snap": false to keep the bearing you gave.
Code: src/view.ts, chooseBearing in src/scene.ts.
Ground
Each OSM area is classified by its tags as water, island, park or grass, wood, marsh, sand, bare rock, parking or cemetery, and drawn as a flat fill in that order. Cover that lies mostly over water (the trees on a river island) is drawn over the water; the rest is drawn under it, so a park mapped around a lake, as Central Park is around the Lake, does not paint the lake over as lawn. Rivers are drawn from their mapped area, never from their center line. Canals, streams and ditches are drawn as ribbons of a typical width.
Roads and rail become ribbons. A road's width comes from its width tag if it has one,
otherwise from its class: 14 m for a motorway, 7 m for a residential street, 1.8 m for a
footway. Tunnels are left out. Railways are 3.2 m ribbons with dashed ties. Weirs and dams
are drawn as white crests.
Land cover from NLCD, where a region uses it, goes down first, between the bare ground and OSM's own areas. Each 30 m class is resampled onto the terrain grid and grouped as woods, evergreen woods, swamp, marsh, field, crop, scrub or barren. The groups are then blurred, a Gaussian of 12 m (0.4 of a 30 m cell), and a group covers the ground wherever it outweighs every other group and bare ground; the edge is traced with marching squares between the grid nodes. A diagonal edge of 30 m steps comes out within about a meter and a half of a straight line, so the source's blocks don't show at print size, and a single 30 m cell still keeps a small rounded patch of its own. Two patches that meet share one edge, with no gap or overlap between them. Open water and unknown cells carry no weight, so the cover runs to the shore, where the shoreline cuts it. OSM's parks, woods and marshes are drawn on top of it, so mapped detail wins.
Code: src/classify.ts, buildScene in src/scene.ts, cover in paintStrip in src/render.ts.
Coastline
OSM does not map the sea, or tidal water like the Chesapeake Bay, as water polygons. It maps the coastline as lines with the land always on their left. isoscape joins those lines into chains and cuts them where they cross the frame. It closes each piece of land by walking the frame's edge, and the water is the frame minus the land. The result can be wrong if the coastline near the frame is broken or mis-tagged. A nature reserve whose outline lies wholly in the sea is an underwater park, so it is not drawn as green ground.
Code: src/coast.ts.
Terrain
With terrain turned on, the elevation is resampled onto a regular grid in the camera's
coordinates, every 5 m by default (cell). A light blur removes the curbs, rubble and noise
that 1 m lidar records and a 5 m grid would turn into speckle.
The scene's height at any point is its elevation above the lowest point in the frame (the
datum), times terrain.exaggeration. The sample regions draw hills 2.5–4× taller than
life, so the landform reads from a distance. Buildings and bridges keep their true heights on top
of the exaggerated ground, so a 2.5× hill does not stretch the towers standing on it. A modeled
building whose parts give their levels above sea level (a porch at 67.4 m, columns on it, an
entablature at 79.2 m) keeps them true too: they are measured from the ground under the model
(the median of the lowest ground under each such part), which is drawn where the terrain is, so
an entablature still rests on its columns in a view drawn three times taller than life.
Contours are computed from the true elevation; the hillshade from the drawn, exaggerated surface, so it matches the shape you see:
- Hillshade. The ground is lit from the left and a little toward the camera. The light is worked out at every grid node, from the surface smoothed once over its neighbors (a 3×3 blur), so it changes smoothly from node to node. The shading is then drawn as nested bands, two to each of 12 steps lighter or darker (24 each way), whose edges are traced with marching squares between the nodes. Each band adds a thin wash on top of the one it sits in, so the ground shows smooth, soft shading rather than 5 m squares, and no two shades meet edge to edge. The shading stops exactly at the traced shoreline: the water is cut out of it, and its bands bend where they cross the shoreline, as the ground does. It is not drawn on the river. Steep ground is held back: past 5 steps either way the shade grows only logarithmically (5 + 2 · ln(1 + (s − 5)/2) steps for a slope worth s), so a bluff, cut or embankment turned from the light darkens smoothly instead of piling up as a dark smear. A face that would be 17 steps dark shows about 9, one at 40 about 11. Gentle ground stays under the knee and is drawn exactly as it was; lit slopes never pass about 6 steps, however steep, so they change by less than a sixth of a step.
- Contours. Marching squares every 2 m by default (
contour), with every fifth line heavier (majorEvery). There are no contours over water: they are cut at the shoreline too.
Code: src/terrain.ts, paintStrip in src/render.ts.
Rivers
Lidar over a river is not the river. 3DEP's bare-earth surfaces are mostly hydro-flattened, level across the water and stepping down along it. But OSM's water outline never matches them to the meter, and rocks, ledges and overlapped banks stand above the water. Draped naively, the river would climb its own banks.
So the river's surface is recovered. At each water point on the grid, it is taken as a low value (the 15th percentile) of the elevations of all water points within 30 m. It is then smoothed along the water. The river ends up level across its width and falling along its course, steeply only where it really drops.
Water points standing more than 1 m above that surface, at least two grid cells (10 m at the default 5 m grid) from shore, are drawn as exposed rock. These are the boulder fields of the falls. Each boulder sits up to a third of a cell off its grid point, chosen by a hash of the point, so a field of them does not read as a honeycomb in rows. Where a hydro-flattened river steps down, the water just above the step stands clear of a surface read partly below it; so a rock must also stand more than 1 m above a low value (the 15th percentile) of the water within 30 m that is level with it or further up the channel. Otherwise every step would be drawn as a line of boulders.
Only a river gets rocks and rapids. Water mapped as a river (
water=river,rapidsorstream, orwaterway=riverbank), or plainnatural=waterwith a river or stream line running through it, is a river. A lake, pond, reservoir, basin, treatment works, canal, dock, pool or fountain, and the sea, are still water: they get neither.Nothing is drawn as rock on ground painted over the river (a bed of bare rock, a wooded island the water outline left in), or within 20 m of a mapped weir or dam: the lidar sees the dam standing clear of the water, but it is drawn as a crest, not as boulders.
Near the shore, mapped "water" standing more than 1 m above the surface is treated as bank. It is given back to the land at its own height.
Where the elevation source has no heights (3DEP leaves much of San Francisco Bay empty), the gap is filled in from the shore around it. That fill is a guess, not a surface, so no rock is read within 30 m of it, and no fall is read on it or from it.
Both are inferences: a gravel bar mapped as water or a misplaced outline can produce false rock. Flat regions skip all of this and draw OSM's outlines as they are.
Code: settleWater in src/terrain.ts.
Rapids
A rapid is where the recovered water surface falls quickly along the river. 3DEP's water is hydro-flattened: level from bank to bank, stepping down along the river by a meter or less at a time, with long level reaches between the steps. Measured across a few cells, the fall is all at the step lines and nil between them, which is not how a river runs.
So the fall is measured along the channel, over a reach. First, every point of a river
gets its distance up the channel: the shortest path through the river's own water from where
it rises out of its lowest pool (the water within 5 cm of its lowest level; in Richmond, the tidal James below the Mayo Bridge). Then, at
each water point at least two grid cells from shore, the surface heights of the river around
it, within 200 m and from 50 m below it to 200 m above it along the channel, are fitted
against that distance. The slope of the fit is the fall. This spreads each step's drop over
the 200 m below it, where the water runs white, and reads the pool above a dam as calm to
within 50 m of its crest. Where the fall exceeds terrain.rapids (0.004 by default, 4 m per
km), the point reads as a rapid. For comparison, the James falls about 32 m (105 feet)
through Richmond, a little over 3 m per km on average, and its level pools fall about 1 m
per km.
Each rapid point gets short white strokes across the current, as thick as the fall: a stroke in about one point in seven just over the threshold, rising to one in most points and two in some at four times it (16 m per km), with a faint wash of froth that fades in over the steepest. So a reach reads as broken water and not as even hatching along the steps of the lidar's surface, each stroke sits anywhere in its 5 m cell, turns up to 20° off square to the current and runs 2 to 7 m long; a smooth field of clumps about 20 m across scales how many points get one (0.4 to 1.6 times, 1 on average), and each point's froth is a soft, uneven blob off its center rather than a square. Only points over the threshold ever get a mark. The strokes are placed by a hash of the point's position, not at random, so the same data always draws the same marks. No rapid is drawn on ground painted over the river. Weirs mapped in OSM are drawn separately.
Rapids are inferred, not observed. They show where the lidar surface falls, which is usually where the water is white, but river level on the day of the survey, where the hydro-flattening put its steps, or a dam can all mislead it. Until November 2026 the fall was measured across 40 m against a threshold of 3.5 m per 100 m; once the elevation was put where it belongs, nothing on the James fell that steeply, and the rapids drawn before had mostly come from water outlines lying on banks. The build's tab reports how many points were read as rapids.
Code: channelFall and riverFall in src/terrain.ts, paintStrip in src/render.ts.
Shoreline
With terrain, the water's edge follows OSM's outline, traced between the grid's nodes: each node holds its distance to the nearest edge of the mapped water and islands (positive over water, out to two cells either way), and the shoreline is drawn where that crosses zero, which is the outline itself, a straight edge exactly. A grid that only knows wet and dry nodes can put the shore only halfway between them, and a shore running slantwise across the grid came out as a staircase, a run of nodes long and a cell high; on a steep, exaggerated bank each step stood up as a tooth.
The lidar still corrects the outline where it has to. Mapped water that the lidar finds more than 1.5 m above the river (a bluff the outline overlaps, a creek in its ravine), or lower than that but more than two cells from the outline (a bar or a rock in midstream), stays land, and there the shore is traced as before, through the wet and dry nodes smoothed over 3 × 3. Mapped water lower than that and near the outline is drawn as water.
The ground meets the water on the shoreline. On the water's side of it the ground lies on the river's surface; on the land's side it rises from the surface to its own height one cell inland, in proportion to the distance. A shore cell is drawn as two pieces that meet on the line, land and water, and anything else draped across the line (cover, parks, roads, the hillshade's bands) gets a point where it crosses, so it bends there with the ground and does not stand clear of it, over the water behind.
Narrow water follows its outline too: a canal a cell or two wide keeps its mapped banks instead of ending in shards cut along the grid. Water so narrow that no grid node falls in it (a stream mapped as an area under a cell wide) is still not drawn.
Code: shoreField and Terrain.z in src/terrain.ts, paintStrip in src/render.ts.
Buildings
Every OSM building that lies wholly inside the frame and covers at least
minBuildingArea (12 m² by default) becomes a prism. Walls are drawn on the sides facing the
camera, and the roof goes on top. Courtyards work. Wall shading follows which way each wall
faces, with the light from the left. Roof color follows the building's type: homes,
commerce, industry or civic. Where a building is mapped as Simple 3D Buildings parts
(building:part), the parts are drawn instead of the outline if the parts that reach the
ground cover at least half of it. Many outlines carry parts only for a crown, a tower or
rooftop works; such an outline is drawn whole, and its parts only above its roof. Parts that
are only roofs (building:part=roof) never replace the outline: it stays as their podium. A
building is drawn whole or not at all, so parts whose outline the frame cuts are left out
too. Nothing stands on air: a part raised off the ground (min_height) that nothing beside
it holds up, and that is not mapped as a bridge, reaches down to the roof under it or to the
ground (a crown whose shaft is missing from the data, or too small to draw). A bridge tower's
parts (tower:type=bridge) are often mapped from the top of the pier up, with the pier left
out, so the lowest of them (no tower part within 40 m starts lower) reach down to the ground
or water; struts between the legs keep their height. Open canopies (building=roof) are left
out.
Two shapes are not prisms. A lattice tower (tower:construction=lattice, such as the
Eiffel Tower) is drawn whole as a spire on its outline, in 16 stacked tapering pieces, in a
darker iron tone. The outline is first cleared of corners within 3% of √area of their
neighbors' line (about 3 m on the Eiffel Tower), so the small jogs where a leg meets an arch
don't run up the tower as slivers, and dots go only at the corners of its foot that face the
camera. Its width follows the Eiffel Tower's curve: e^(−3.3·t) of the base at
height fraction t, so 0.56 at the first platform and 0.32 at the second, running out to a
mast over the top sixth. The parts mapped inside it are dropped. A curved roof shell with
no height (a roof part shaped round, spherical or circular, such as the Sydney Opera
House's sails) is drawn as a sail rising to a point, 1.6 × √area meters above its podium.
That height is an approximation, not a survey.
Footprints from Microsoft's model fill in where OSM has none. Wherever an OSM building and a footprint overlap, OSM wins and the footprint is dropped. A footprint is dropped if its center lies in an OSM building, or if it holds an OSM building's center. A footprint whose center is on water is dropped too: there the model has found a boat, a pier head or a boathouse it cannot tell from a house. Buildings mapped in OSM on water, such as boathouses, stay.
Heights are taken from the first of these that the building has:
- a
heighttag, from a survey or a mapper's estimate (a whole building tagged under 2 m, or with a height that can't be read, is taken as having none: Los Angeles County's import gives hundreds of hillside houses 0.4 m). In maps that turn oncheckLevels(downtown Richmond), an apartment building, dormitory, hotel, house, terrace or office tagged more than 5.5 m a floor is taken as mistagged and drawn by its floors instead: there a six-story apartment building is tagged 80 m and a twelve-story one 96 m; - an estimate from Microsoft's model, for its own footprints, where it made one;
building:levels, at 3.4 m a floor, plus half a floor for each roof level;- a guess from the building's type and size: 3.2 m for a shed or anything under 40 m², 8 m for a house, 10 m for a terrace, 16 m for apartments or a hotel, 13 m for an office (24 m over 1,500 m²), 11 m for industry, 16 m for a church, and 8–14 m by footprint for anything else.
Each build counts how many heights came from each source. A view with many guesses has the right footprints and plausible but invented skylines. Joining real heights from lidar (the first-return surface minus bare earth) is the top item on the roadmap.
On a slope, a building stands on the lowest ground under it, so its walls never float. The ground is drawn steeper than life but buildings keep their true heights, so the roof is set by the true slope, not the drawn one: it sits at the building's height above the lowest ground plus half the true fall across the footprint (the drawn fall divided by the exaggeration). On the downhill side the building shows what it would on the real hill, and the rest of the drawn relief goes into the hill on its uphill side, so a two-story house on a steep street stays a two-story house. On flat ground nothing changes. The parts of one building all count their heights from the level of its outline, and buildings traced from fire-insurance maps and lost landmarks are seated the same way.
A building that spans water, one OpenStreetMap gives a layer of 1 or more and that has
mapped water under its center (a mill or a house over a canal), stands on the banks: in maps
that turn this on (seatOnBanks; downtown Richmond), its height counts from the ground at its
corners on land, not from the bed of the water under it. Its walls still reach down to the
water. In downtown Richmond this moves one building, over the Haxall Canal, from a roof below
the bank in front of it to a roof 4 m above it.
Code: buildingHeights in src/classify.ts, extrude and spire in src/scene.ts.
Bridges
OSM splits one bridge into many ways, at every change of lanes, name or junction. Ramping each piece down to the ground would turn a viaduct into a roller coaster. So bridge ways that share an end, a layer and a kind (road or rail) are joined into chains first. At a fork a chain carries on along the straightest way, and never through a turn sharper than 60 degrees, so two tracks that meet are not joined into a V. A chain only ramps down at an end that touches no other bridge. Bridges that touch form a network, anchored to the ground at those ends, and no deck stands higher than a 70 m ramp from the nearest anchor allows, measured along the network: a viaduct that forks into short ways that each come down a few meters on ramps down to the fork, not standing at full height over a fan of steep stubs. An end that joins another bridge (a ramp onto a viaduct of another layer, a link at a fork) meets the higher of the decks there and eases to its own height over 70 m. Then the decks are matched at every node they share: a deck that runs on through the node sets the height there, and where only ends meet, the highest end does. The others run straight to that height, so no deck stops short in mid-air above or below the one it joins. Where a deck comes down to the ground, its side stops at the ground instead of hanging below it.
A deck runs straight between its ends. It never dips below the straight line between the heights of its two ends, and rises above that line only where it needs its clearance: an overpass whose ends are both at street level spans a cut level, whatever depth the cut has, and ends at different heights give a straight grade. A grounded end sits on its abutment. In a smoothed ground model an overpass mapped rim to rim ends on the sloping sides of the cut, so the ground is read for 12 m past the end: where it climbs within the first 6 m and then levels off (the outer 6 m climbs less than three quarters as much), the end sits at that level, with an abutment wall down to the ground when the end faces the camera. Where the ground goes on climbing (a ramp landing on a hillside), the end sits on the ground.
Ground the model kept under a deck is carved out. A bare-earth model is meant to have bridges taken out, but a short overpass often stays in it as a ridge of ground across the cut it spans, and the road under it then climbs over a hump. Under every deck, a grid node that stands more than half a meter above the ground 8 m past the edges of the decks on both sides takes the straight line across between those two. The carving fades in over the 10 m nearest a grounded end, so the street running onto a bridge keeps its level, and it never raises ground: a deck along a hillside or a bluff's crest changes nothing.
Parallel ways of one street are one deck. OSM maps a street's carriageways and its sidewalks or cycle tracks as ways of their own, side by side, and each would get a profile of its own: a sidewalk sitting lower beside its street, a divided street as a cluster of tilted slabs. A footway, path or cycleway bridge that lies within 15 m of a street's bridge its whole length, running the same way along it, takes the street's heights wherever it lies beside it (a street before a ramp beside it); so does a carriageway beside a longer one of the same name, kind and layer. A bridge way shorter than 10 m that shares a node with a longer deck is drawn level, at that deck's height at the node.
Skyways are left out. A footway, path or cycleway bridge no longer than 80 m with an end in or within 3 m of a building is a skyway or a bridge into an upper floor, and OSM rarely says which floor. Drawn at a ramp's height, it lies across the walls and roofs of the buildings it joins, so it is not drawn (sidewalks beside a street bridge are kept). It is decided from the buildings' outlines before the ground is carved, so the ground under a skyway is left as it is.
Deck height is a rule of thumb. OSM rarely records it. A region can name a height for a
bridge, for example { "match": "Manchester", "deck": 24 }. Otherwise the deck sits
bridgeDeck meters (7 by default) above the ground for each OSM layer. The deck is a taut
line over whatever it crosses: never closer to the ground than its clearance, rising in
straight runs, and easing down over 70 m at a free end. The ramp keeps that length on a short
bridge, so a bridge shorter than two ramps never reaches full height: a 30 m footbridge over a
canal rises well under a meter above its banks, where a 7 m tent would read as a stub floating
in the air. Piers drop to the real ground or water every 38 m where the deck is more than 3 m
up, or to the roof of a building under the deck, never down through it. Each pier is
ordered on its own, behind its deck and behind a building nearer the camera. A span that lies
inside a building and below its roof (a garage ramp, a walkway's landing) is left out: the
building hides it.
Each bridge is cut into spans of at most 22 m, so a long bridge can pass in front of one building and behind another. Bridges are cut at the edges of the frame.
A suspension bridge (bridge:structure=suspension) whose towers are mapped as parts
(tower:type=bridge) gets its two main cables, drawn as plain lines. The parts standing
within 25 m of the bridge's line make its towers, and the parts either side of the widest gap
across the line are a tower's two legs. Each cable runs from an anchorage on the deck at one
end of the bridge, over the tops of the legs, to the other end: a parabola between towers
that sags to 2 m over the deck at mid-span, and a slighter one down to each anchorage.
Suspenders, tower detail and arches are not drawn.
Code: carveUnderBridges, isSkyway, chainBridges, joinDecks, groupDecks, deckProfile,
abutmentLevel and bridgePieces in src/scene.ts.
Paint order
The drawing has no depth buffer. Things are painted back to front, and the order is the hard part. Sorting by a single depth per object fails as soon as a long warehouse sits beside a small house. So the order is decided pairwise, only between objects whose boxes overlap on screen:
- If their footprints can be separated by a line, the one on the camera's side of that line is in front.
- If the footprints overlap (stacked building parts), the one entirely above is in front.
- A pier and a deck whose footprints overlap: the deck is in front (a deck's height range starts at its underside, so a deck over another deck is in front of it too).
- Two bridge spans that run side by side (within about 14 degrees of parallel, the two carriageways of a viaduct or a pair of tracks): the one whose line is nearer the camera is in front, or the upper one where one runs right over the other. By centers alone, two overlapping decks alternate span by span and read as a ladder.
- Otherwise the nearer center wins.
A topological sort turns these pairwise results into one order. The rare cycle, from concave
footprints that interlock, is broken by depth: the farthest item left is painted next. That item
may lie in no cycle at all (a tower behind a building whose attic floors and roof form one) and
then paints before parts it should follow, so a cutaway can ask instead (cutaway.order: "components", Main Street Station) for the farthest item that lies in a cycle, found as the
strongly connected groups of the items left.
Code: src/order.ts.
Drawing
The ground is painted in strips, two grid rows deep (10 m at the default cell size), from the back of the frame to the front. A landscape hides parts of itself: a bank that falls away from the camera hides the water behind it. Each strip drapes everything that lies on it over the terrain: bare ground, parks, water, roads, rail, hillshade, contours, rocks and rapids. Each building or bridge is painted straight after the strip that holds its front edge, so a hill in front of it covers it and the ground behind it does not.
The next strip's parks, roads and cover lap 0.6 m back over a strip's near edge, so a strip's hillshade and contours are shifted the same way: each runs from just past its near edge (0.6 m plus the width of the edge strokes, about 1.1 m at the sample scale) to the same distance past its far edge. The ground in that lap is then shaded once, by the strip that painted it last, and no light streak shows along the strip lines. Where two strips' shading meets, both trace the same points, so there is no hairline between them.
Within a strip, the water is one path: the wholly wet cells and the wet parts of shore cells together, so they meet without a seam. Cover and parks that lie under water (a park drawn around a lake) are cut out where the water is, so nothing of theirs shows through where one strip's water meets the next's; on a lake those seams had shown as faint lines.
Each park, wood or other ground shape is cut to the strip as one polygon, holes and all, and comes out as its separate pieces. Cut one outline at a time, a wood with a clearing or a notch of bare ground in it kept an edge along the strip's line across the clearing, enclosing nothing; since ground shapes are outlined in their own color (0.6 units wide) to close the seams between them, each such edge showed as a green line, and the clearing was ruled with them one strip apart.
The ground reaches a cell past the plate's sides, and the sides are then covered in paper, so each side is one clean edge. (Cut by a clip, a renderer that clips each shape in turn laid the edge once for every shape that reached it, and a side over water showed a dotted line.) A plate with no slab (a cutaway) is cut square by its own rectangle instead, and its ground ends at its sides.
The front of the plate is a slab, a true cross-section of the ground along the near edge,
with water where the cut crosses water at least two cells wide, from shoreline to shoreline.
A stream narrower than that cuts no stripe down the slab. A region with no slab ("slab": 0, the cutaway) is
cut square instead: the ground ends on straight lines, at the lowest point of its far edge on
screen and the highest of its near edge, so its edge does not wander with the ground, and
standing things are cut along the same near line.
The SVG is compact. Coordinates are rounded to a tenth of a pixel and written relative to
the previous point. Draped edges are simplified to a quarter pixel, and the soft edges of
hillshade bands to half a pixel: a point is dropped only while the line that replaces it
passes within that distance of every point it stands for. (Until November 2026 each point
was tested against its two neighbors alone, so a long, gently curving edge could drift
several pixels off; across open water, where nothing covers the strips, the gaps showed as
white stripes.) Each dot is a zero-length
line with round caps. Even so, a big region can produce a file of 25–45 MB. The --png option
renders a raster with rsvg-convert. Colors and line weights come from a palette (paper
or night).
Code: src/render.ts, src/palette.ts.
Time
A region with a time section is drawn as a series: one scene for each year (epoch) in its
history file, built with isoscape series <region>. The downtown Richmond series runs from
the 1737 town plan to today. Each scene combines two kinds of evidence, and the explorer says
which is which.
Measured: buildings standing today, by the year each was built. A building appears in every scene from its year on. The year comes from:
- a curated year, for buildings whose records are known to be wrong or missing (the
Capitol, St. John's Church, the Old Stone House, and every tall downtown building: see
below), each with a source. A curated year can also end: the Capitol's central block (OSM's
middle building part) is drawn alone from 1788, and its full outline, with the wings of
1904–06, from 1906. A curated year can also be unknown: a building whose only date is a
parcel's that is known to be wrong, and for which no source gives another, is drawn in
today's scene only. A building part (
building:part) takes the curated year of the building it belongs to, so a tower's crown is not dated by its parcel apart from the tower; - else OpenStreetMap's
start_datetag; - else the city assessor's year built for the parcel under the building's center.
The assessor records one year per parcel, the year of its main building. Up to four buildings
on a lot (a row split in OSM, a house and its shed) all take that year. With more buildings,
only one clearly larger than the rest takes it. A parcel with eight or more (a campus, Capitol
Square) gives its year to none of them, and nor does a parcel holding a curated building. A
parking structure (a deck or garage) that only its parcel dates, to a year before 1960, is
dated 1960 (parkingFrom), with surface parking: the parcel's year is its lot's earlier
building's. Buildings with no year appear only in today's scene.
Tall buildings are checked one by one. In downtown Richmond every building 25 m or taller, or of eight levels or more, drawn in a printed past scene (1865, 1886, and the 1905 to 1990 panels of Richmond, 1737–2026, as well as 1925 and 1950) is dated from a source that names it (the National Register nominations for the Main Street Banking district, SkyscraperPage, Wikipedia and its list of Richmond's tallest buildings, the SAH Archipedia), or is drawn in today's scene only (three parking decks and an annex of eight levels or more, whose only date is their parcel's). The Ross Building at 801 E. Main (eighteen floors, 1965), which its parcel had put in 1925, now first appears in 1970; what stood on its lot before is not known, so the lot is empty in the earlier scenes.
Curated: what is gone or was different. A short list per series, each item with its years and sources: a filled canal basin, a burned district, a buried creek, demolished landmarks drawn from published dimensions in a red-brown tone (a burned shell in ash gray), and the town plan, which limits the earliest scene's streets to the original grid. Positions come from today's street grid. They are not surveyed.
Water that is gone. A filled basin or a canal since drained, drawn on today's ground as it lies, came out as a cliff where the ground stands high and as broken shards where it dips. So curated water, and mapped water whose era ends before today (the canal's downtown end, 1800 to 1890), is drawn as still water at its own level: the median of today's ground within 20 m of it, less 1 m. Every grid node inside it is that water; out to 20 m from its edge the ground eases (a smoothstep in distance) from 1 m above the water back to today's, so a low side becomes an embankment and a high one grades down to a clean bank. The Great Basin is drawn whole until 1880; in 1886 what was left of it (water between 9th and 10th Streets and a narrow basin between 11th and 12th, traced from sheet 11 of the 1886 Sanborn map) and the canal's last stretch into it (sheet 10, and the 1886 key map) are drawn as the map shows them. A canal mapped only as a line is a blue ribbon on the ground.
Ground that was cut or filled later. The ground in every scene is today's lidar, so a
past year drawn on it shows every cut and fill made since. A series can put back the ground a
later work took (ground in its history file), for the years before it; every other scene,
and every series without one, draws the measured ground unchanged. The first is Jackson Ward,
where the Richmond–Petersburg Turnpike (1955–58) runs in a trench up to about 8 m deep (3 to
6.5 m where the old cross streets ran). Inside a curated outline the lidar is set aside before the
grid is blurred, so contours, hillshade, the drape and building bases all see the result. The
outline is today's motorway ways buffered 22 m and ramps 10 m, widened over cut and fill slopes
the lidar shows (steeper than 12% within 60 m of a motorway), then simplified to 4 m; it covers
about 28 ha of trench and 9 ha of interchange. Two methods, each an estimate:
- Membrane (
restoreGround), for the trench: the rebuilt ground is the smoothest surface that meets the measured ground at the outline (each free node the mean of its four neighbors, solved by over-relaxation to 1 mm), held along each street that crossed at grade to a straight grade between its surviving ends. Seven such streets are listed; they change the result by about 6 cm RMS and 0.58 m at most, so the rim decides it. - Lower (
lowerGround), for the ramps at the I-64 junction, which stand on the old plateau rim: a grey-scale opening of the lidar with a 25 m disk, so banks narrower than 50 m (embankments up to 9 m high) come down to the ground beside them and broader ground stays as measured. The USGS Richmond sheet surveyed in 1933–34 shows the rim there at about today's height; a membrane, which would have sloped plateau to valley, was up to 9 m too low.
Two checks set the error. Run on undisturbed plateau beside the trench (the same outline moved
150 to 450 m southwest, six trials), the membrane misses the measured ground by 0.3 to 1.1 m
RMS, 95% of nodes within 0.7 to 2.9 m; moved onto the valley edge north of it, 1.8 m RMS and up
to 8 m. On the USGS sheet (10-foot contours, about 3 m; its datum about 0.32 m above NAVD 88
here) no contour can be read within 60 m of seven points along the trench from west of St. Peter
Street to past Fifth Street, and the rebuilt ground there would need to move at most 0.8 m to agree. So the
error is put at about 1.5 m (95%) mid-trench, 3 m at its ends, and more where the sheet shows
a small ravine near Seventh Street that neither the lidar nor the membrane has. Streets that cross on bridges today are drawn at
grade before 1958, and curated lost streets (kind: "street", the stretches the trench took,
straight between surviving ends) are drawn on the rebuilt ground.
Bridges that are gone. A curated bridge is drawn as a bridge of today's map would be, from
its own line: a road or railroad deck at a stated height over the ground or water under it
(the Free Bridge of 1873 to 1972, 8 m, an assumption), on piers, ramping down to the ground at
each end, where it lands on a street of its year. Bridges replaced on their old line (Mayo's
Bridge before 1913, the Richmond and Petersburg bridge before 1902, the Richmond and Danville's
before the Southern's) are drawn on today's line and height in their years, an
approximation; none is drawn in 1865, the scene after the fire that burned them. A curated
item can be held back from builds made before it existed ("switch"): it is drawn only in a
build asked for it by name (isoscape build --with next), and the build records that,
so a print already sold is still made exactly as it was. The Free Bridge is drawn only so: the
1925 and 1950 prints, version 4, were drawn without it. Its line is approximate, so in builds
made --with next,next2 (the 1925 and 1950 prints' version 5) a traced building with any part
within 12 m of it is left out, as one under a rail viaduct is: otherwise its deck ran over the
roof of a frame building on the canal bank.
Traced: buildings from fire-insurance maps. The Sanborn Map Company drew every building in a city's business district for insurers, block by block. Each building appears as a footprint colored by material: pink brick, yellow frame, blue stone, gray iron. The Library of Congress has Richmond editions from 1886 to 1925 online. isoscape traces them:
- Georeference. Each sheet is placed on the ground by a rotation and shift: at one scale
per edition, two or three named street corners read off the sheet are enough. A third
corner checks the first two. The block outlines from the city's GIS are drawn over each
sheet to confirm the fit (
tools/sanborn/rigid.py,ovmosaic.py). - Trace. The colored fills are separated from the paper and the printed lines, read for
material, closed over the lettering, and traced as polygons. Near-rectangles are squared
up, and outlines and thin strips (river banks, rails) are dropped (
extract.py). - Follow through time. A traced footprint mostly covered by a building standing today is
taken to be that building, or its replacement on the same footprint, and today's data
already draws it. The rest are lost buildings. Each is drawn from the first edition
that shows it, though it may be older. It is drawn until it is known to be gone, in this
order of preference: a later edition that maps the spot without it; the year the building
on its site today went up; the opening of an expressway through it. Failing all of those,
it is assumed gone by 1960, when clearing for parking and highways began
(
lifespans.py). - Clean. A last pass drops slivers, any footprint more than 8 times longer than it is
wide and under 12 m wide, or over 100 m long and under 8 m wide on average: on the sheets these are rail viaducts, track-side sheds and street
edges, and extruded they would stand as walls. It then smooths each outline to within 1.5 m,
so pixel stair-steps do not draw as striped walls. It also drops sprawls (over 2,000 m² and
filling under 45% of their convex hull: river shading, not buildings) and merges footprints
traced in two editions that overlap by more than 85%, keeping the earlier start and the later
end (
clean.py: 68 dropped, 170 merged). - Shapes. A second pass (
clean.py --shapes) drops the strips the first missed: a bent ribbon (filling under 30% of its smallest enclosing rectangle and over 60 m long), and anything under 4 m across at its widest and at least four times as long; and sawtooth outlines, over 1.35 times the length of their convex hull's while filling under 70% of it, on a strip 80 m long or more (a hatched edge read tooth by tooth) or on a footprint under 1,000 m² (a star of spikes around a shed). It trims spikes with an opening of 1.5 m (shrink, then grow back with square corners), which takes off anything under 3 m wide; a footprint left with under 60% of its area is dropped. Of the 2,604 footprints, 41 strips, 50 sawtooth outlines and 21 spiky footprints were dropped and 247 trimmed; of those standing in 1925, 45 were dropped and 85 trimmed, and in 1950, 49 and 103.
A sheet whose fit is known to be wrong is left out until it is placed again, and the history file says why: the 1905 sheets 5 and 7, read by eye, put 31 buildings on the Capitol Square lawn, so neither is drawn.
A sheet gives the buildings but not the ground they stood on, and its fit is good to a few meters only. So a traced building that could not have stood where it falls is left out whole, never trimmed, and the explorer counts how many and why:
- On water. Any part of it on the water drawn in its year: past the traced shoreline, inside today's river or canals (a canal mapped only as a line counts at its drawn width), or a curated basin, read every meter over its footprint and along its edges. Most are mills on the islands and races above the Mayo Bridge and warehouses on the Great Basin's edge. In downtown Richmond 27 in 1925 and 24 in 1950.
- On a viaduct or a track. Any part of it within 12 m of the center line of a rail viaduct standing in its year (most were mapped in 1886 or 1895 and cleared for the viaducts of 1901, the rest are misplaced by their sheet, and drawn, the deck would pass over their roofs or between their walls), or within a meter of the ballast of a track on the ground: 61 in 1925 and 34 in 1950.
- Buried. Today's ground more than 3 m above its floor anywhere under it (read every 2 m over its footprint and along its walls, not only at its corners: a slope can stand above a long wall between two low corners), within 60 m of a road built after its year (an interstate's cut or fill), or more than 8 m above it anywhere (two stories and more: no building stood cut that deep into a hill): 62 in 1925 and 55 in 1950.
The historic buildings are sketches, not a survey. A machine traced them from scans of fire-insurance maps, so outlines are approximate, heights are guessed from material, and some buildings are missing, misplaced or merged. The 1924 overview ("congested district") sheet is the least precise source. The historic scenes show the city's shape and density, not each building exactly.
Traced buildings keep the maps' colors, so they read apart from today's. The story counts printed on the sheets are not read yet, so every traced building's height is assumed from its material, at 3.6 m a story: brick three stories, frame two, stone three, iron (gray: sheds and warehouses clad in metal) four, "special" (the maps' other hazards) three, and fire-proof construction (olive-brown, in later editions) six. The dated prints say so under their credit line. The explorer counts, for each scene, how many traced buildings stand and how each one's end date was found.
Five editions are traced: 1886; 1895 and 1905 (sheets read by eye); 1924–25, whose first volume opens with a single "congested district" map of the whole business district (fitted with a rubber sheet through sixteen street corners, each snapped to the city's block outlines); and 1950–52, a corrected reprint whose sheets were matched feature by feature to their 1924–25 versions where those were fitted, and read by eye otherwise. Each later edition turns "assumed" end dates into ones read from a map.
Jackson Ward north of Leigh Street is traced from volume 3 twice: as republished in 1952, and as
first printed in 1925. The 1952 sheets were fitted to street corners; each 1925 sheet is matched
to its 1952 reprint feature by feature (a homography with a gentle quadratic correction for the
paper, the matches agreeing to a median of 0.08–0.13 m) and placed by the same fit, then traced
from its colors, which in 1925 cover every building. The color fills keep the stair-steps of the
scan, so the drawn outlines are then simplified (Douglas-Peucker at 1 m, less where that would
stray further) and squared where every edge is within 12° of the building's axes, with no wall
moved more than 1 m and nothing dropped or merged: 61,738 corners become 21,833, about six a
building, where each corner had drawn an edge and a dot. A 1925 building is drawn until 1952 and the
1952 tracing carries it on; one the 1952 sheets no longer show ends in 1952, or in 1941 on the
blocks cleared for Gilpin Court. Before 1952 the coarse buildings from volume 1's small-scale
overview that fall in those blocks are left out (leaveOut with ids and before), so the two
sources do not draw one building twice.
The 1952 layer gets the same simplification where its outlines are busy (more than 10 corners): 703 of them, 17,243 corners down to 5,574, the largest move 1.00 m. Second Street from Broad to Clay is on volume 1 of the 1950–52 printing; its sheets 2 and 3 are fitted again to 13 street corners (residuals 0.5–2.9 m) and traced, and 198 outlines the earlier tracing missed join the Jackson Ward layer. Streets the trench took are read off the 1952 sheets as center lines and placed by each sheet's fit; a 2 m step counts as a street that survives when it lies within 9 m of one drawn today running within 30° of its direction, and what is left is kept where at least 20 m of it, and at least 40% of that, lies in the highway's corridor: 24 stretches, 2,275 m, drawn from 1952 to 1956. In the 1925 scene Apostle Town's streets are drawn as the 1925 sheet prints them (Cabell, Tyler and Hickory on its old line, until 1941), and the ways laid out with Gilpin Court, the 35 that lie at least 80% inside the cleared blocks, from 1941.
Pick-outs and islands. A history switch named with --with can pick out buildings: those
whose center falls in a polygon are roofed in the palette's mark tones and the rest quiet, or,
given a count's ids, exactly the buildings that count lists, so a picture shows what a number
counts. Jackson Ward's count of the 1952 outlines in the Turnpike's footprint skips outlines
under 12 m² (the region's smallest building, which the map would not draw) and a correction
table's box: 216 in today's paved roadway and ramps, 447 in the corridor of 15 m more each side.
An island switch cuts the scene to one polygon and draws it alone on blank paper: ground is
painted strip by strip as always, each strip clipped to the polygon, the cut faces that look
toward the camera are drawn as a slab's sides down to 18 m (the region's slab) below the
lowest ground inside, and only the buildings the count lists stand on it. Jackson Ward's islands
are cut where the traced sheets end, at about 8th Street, so the ramp loop past it, never traced,
is not drawn as empty ground.
Era rules date everything else that OSM maps: the first rule matching a feature's name,
ref or tags decides the spans in which it existed. Interstates appear from 1958, the
Downtown Expressway from 1976, the river viaducts from 1901, Mayo's Bridge from 1788 (today's
of 1913 drawn for every form, and not in 1865), the Seaboard's line from 1900 and station
platforms with Main Street Station (1901). The James River and Kanawha Canal's Richmond Dock
appears from 1800 until the railroad took the canal over, the line of its Tidewater Connection
from 1854, and the Canal Walk's rebuilt channel from 1999. Interchange ramps follow the
interstate and parking aisles and driveways follow surface parking (1960, the year by which
traced buildings are assumed cleared); both dates are approximate.
Two more rules look at what lies beside a feature. A road bridge stands only over something
there in its year: if every road, railway and waterway mapped under a bridge (its spans of one
street joined end to end) is not yet built, the street is drawn at grade instead (and so is a
rail bridge standing alone, with track on the ground at both ends: the Richmond District's
short span over the canal at Rocketts, which in 1925 and 1950 crossed no canal), so in 1950
Broad Street crosses Shockoe Valley on the ground and the streets over the Downtown Expressway
have no bridges. And woods and scrub with 40% or more of their outline within 20 m of a road
not yet built are that road's verges (the planted ground of an interchange) and are dated with
it. (In builds made --with next, the corrections made since the 1925 and 1950 prints' version
4, half the outline within 60 m: the planted banks of the interstate and the expressway that the
tighter test missed.) A feature no rule matches is drawn in every year, so the Richmond series ends its
rules with catch-alls: the street grid, streams and the river are drawn in every year, and
anything else with no dated rule (parks, cemeteries, dams and weirs, piers, basins, paths) is
drawn only today, since nothing says when it was made. Each catch-all names what still needs a
source. Railways out of use or taken up today (abandoned, disused, razed) are drawn
today only, unless a rule dates one from a source (the Richmond and Petersburg bridge over the
James, 1838–1970 but for its year burned, with its approach to Byrd Street Station curated as approximate track, since
nothing of it is mapped today): their fragments end in open ground. Roundabouts appear from 1990, when the
modern roundabout came to the United States, and unnamed service roads of no particular kind
(the drives and rings of parking lots) with surface parking, from 1960; both are approximate.
Past years look at their neighbors once more:
- a minor road bridge (residential, service, unclassified) over a canal, with no
start_date, appears only from 1999, the Canal Walk (canalBridgesFrom), unless a rule names it; - a road bridge whose spans do not meet a road of the year at each of their ends (a tunnel does not count: it is not drawn) is left out: a piece of deck whose approaches came later;
- a bed of scrub, wood, grass or heath, or a pond, under 2,000 m² and unnamed is landscaping, dated with the nearest dated building within 40 m (the development around it); with none that near it is natural ground (a thicket on a river island) and is drawn in every year;
- a rail spur, siding or yard track that ends with no building of the year within 40 m of its end is left out (and the spurs that only led to it): today's spurs serve today's buildings;
- a rail deck's grounded end sits on the ground there, where its track runs on, not on the level of the bank beyond it (the abutment rule for streets over a cut, below): seated on the bank, the river viaducts' decks ended a few meters above the track they join;
- a building's walls that face the camera with both corners above its lowest corner stop, level, at the lower of the two, where the ground in front of them starts. Run down to the lowest corner, as in today's scene, the ground painted in front of such a wall (in a hollow, or beside a later cut) covered it along a strip's straight edge.
The two sets (the 1925 streetcars and Broad Street in 1943) switch on more of these rules in
their histories, each off unless a history asks for it. Laid-out ground by its parcel:
lawns, beds, pitches, playgrounds and service roads take the assessor's year built of the
parcel they lie in (a polygon's center, a road's midpoint; not a parcel holding a building with a curated year, whose recorded year is another building's), so the planted strips of a lot paved
in 2017 and the drives of a yard built in 1989 are no older than the lot. More verges:
grass and meadow, as well as woods and scrub, along a road not yet built are its infields.
Approaches with their bridges: where a road bridge is not drawn in a year, the ways that lead
only to it (joined end to end, no other street touching them) go with it, so the street ends at
its last junction rather than in a stub; and a bridge left with an end no road reaches is left
out, then the ways that led to it, up to three rounds. Viaducts clear: a traced building
within 4 m of a rail viaduct or a curated bridge of the year, and any dated building a curated
bridge passes over, is left out. Streets clear: a traced building standing in a street's carriageway (within half
the street's drawn width less a meter of its center line, and at least 2 m) or within 2 m of a
car line is left out (the sheet was fitted a little off). Streets under the cars: a street with half its points within 12 m of a car line
of the year is kept, houses or not; and a building dated only by its parcel that a car line of
the year runs through is left out, its parcel's year taken to be another building's.
Smoother tracing: traced outlines are simplified to 2.5 m and rid of spikes (a corner under
40° with an edge under 8 m), and a gray ("iron") footprint filling under 60% of its hull is taken
for the sheet's shading and left out; every traced building keeps its class's assumed storeys
(brick and stone 3, frame 2, iron 4, fire-resistive 3, fireproof 6), since no sheet's storey
count was recorded. Track on a site: a siding mostly on a curated site goes whole, one mostly
off it stays whole, so none is cut square at the site's edge. Ties: close up, a tie within
0.5 m of one already laid is left out, so the ties of a turnout's two tracks do not clump; farther
out, where tie marks are drawn along the center line, a track's marks within 3.5 m of a track
drawn before it are left out, so where two run together only one pattern shows. Car lines on
a street bed: each car line lies on a band of street 1.5 m wider each side (times the
streetcar scale), so a line that covers its carriageway, or runs where no street of the year is
drawn, still reads as cars in a street; and the red band is painted exactly, cut at the grid
lines, and lapping half a unit on screen further back than the other ground layers, so no seam
or notch shows across it where the paint strips meet. Decks that carry the cars: in the
streetcar set, a road bridge that carries a car line is drawn at least as wide as the line (13.5 m
on the single-stop prints, 27 m on the big map) with the line on it at full width, so the line runs
onto the deck without a step and no square deck end shows beside it; a dated building under such
a deck is left out, a traced one within 4 m of its edge too, and no car is set on a deck shorter
than three cars. On the decks the set names (thirteen, in the boxes for Church Hill, Broad
Street and Manchester and on the big map, including the Mayo and Free bridges and the Marshall
Street Viaduct), the deck is laid on the car line's own center line, as the line is drawn after
straightening, following its bends, a node it shares with another deck moving with it; its
pieces then meet end to end rather than lapping a meter, so the deck's edge strokes run unbroken.
The list keeps the decks of stops already sold as they were. Lines that meet: a line that stops within 30 m of another, short of it, is
carried on straight to meet it. Later roads through woods: a road not yet built with woods of
the year on both sides of it, within 15 m of its edge, is drawn as wood, so the interchange it cut
does not show as a cut-out. A traced building within 5 m of a car line's center (not 2 m) is
left out. Station views: a whole view leaves out
the train cars standing under the raised concourse, and turned parts (the dome) are drawn
shaded and inked only along their foot, so the dome reads as tile at a map's scale, not as a
black disc of facet lines. In the station's set views the platform sheds are drawn with the
cutaway's butterfly roofs and the dome in terra-cotta tile, as it was until 1955. The sets'
regions add: rail bridges over water stand on piers however low their deck (elsewhere a pier
is drawn only under a deck more than 3 m above its foot); the two ways of a double-track viaduct
are one deck at one level; and named deck heights for the C&O's viaduct (12 m, so it clears the
Seaboard's, 6 m, at the Triple Crossing) and the Free Bridge (4 m, approximate: in 1925 its south end meets the street the cars run on; in 1943 it lands at Seventh Street and Semmes Avenue), and piers 75 m apart, not 38 m, under the
Marshall Street Viaduct (approximate: none of its pier spacing is known here; at 38 m one stood in
front of the Richmond Cold Storage building's face and read as standing in it), its first and last
30 m standing on an abutment, the side of the deck facing the camera walled down to the ground, so
the deck is built out from the bluff at College Street rather than hung in the air from its first
pier (the abutment is painted with the end piece of deck, so nothing else is reordered; its form is
approximate). A history can also extend another (extends: its rules and
dates first, its features replacing the base's of the same id), which is how the set's close
views of Broad Street Station take these rules while the cutaway, drawn from the station's own
history, stays as it was sold. The sets take the downtown series' era rules and curated dates
(parking structures from 1960, canal bridges from 1999, buildings no source dates drawn today
only), and add: ramps and turning roads (*_link) from
1958, approximate; disused and abandoned track never in the past unless a rule dates it (the
Richmond and Petersburg bridge, 1902 to 1970, with its approaches to Byrd Street Station and,
approximately, in Manchester); bridges drawn at grade before a year where a source puts the
street on the ground (Fifth and Seventh over Leigh Street before 1971, Campus Drive before
1950, approximate), or where no source says what crossed before today's bridge (Chamberlayne
Avenue over the railroad north of Leigh Street, whose bridges are of 1992, approximate); one
plain low deck where the Boulevard and the fair grounds spur crossed the RF&P's cut before the
bridge of 1943 (what stood there is not known; approximate); two streams left out (Little
Westham Creek, mapped underground below Westhampton Lake, and one east of Nine Mile Road
mapped off its ravine); the park lakes of the year (Westhampton Lake from 1902, Fountain Lake from
1888, Swan and Shields lakes from 1917); basins, settling tanks and treatment works today
only; The Diamond from 1985; and dated buildings with their sources (a parking deck of about
2020, the Cookie Factory's tower of 1927, the art museum's outline only once its wings were
built).
In every scene after the first, buildings new since the previous scene have gold roofs.
Streets before the houses. A series can say that minor streets (tertiary and smaller,
service roads and paths) are drawn only where a building of the year stands within so many
meters of them: 75 m in the 1925 streetcar scene, 60 m in the downtown series. A bridge is never
dropped by this test: it crosses water or a valley where no house stands, and its era rule
alone says when it stood (Mayo's Bridge from 1788); nor is a street that meets a road bridge
(the road across Mayo's Island between two spans, a bridge's approach; in builds made --with next, the whole of that street by name, as Hull Street across Manchester). Each street is
walked every half that distance and kept if any building (standing today and built by then,
traced from a Sanborn sheet and still standing, or a curated landmark) has a corner within one
grid cell of a step. A suburb whose streets were laid out but not yet built on shows its main
roads only. The downtown series holds its main roads to the same test, because before the
first Sanborn map (1886) the only record of how far the town reached is what still stands. A
street of a town plan (Mayo's grid of 1737) is kept in every year from the plan on, houses or
not, though not the plan's service roads. A series can hold service roads (driveways, yard
and works roads) to a closer test: the 1925 streetcar and 1943 Broad Street scenes keep one only
with a building of the year within 25 m, so a works' yard roads are not kept by a house across
the street. Today's scene keeps all of today's streets.
Streetcar lines. A curated streetcar item is a line drawn as a bold red ribbon down the
street, 9 m wide, with a car every 900 m along it: 14 m long and 3.6 m tall like a 1920s
double-truck car, but 5.4 m wide (about twice a real car's width) so its pale roof reads
against the line. A series can scale both up so they read across a whole city: the 1925 scene
draws them three times life size (27 m lines, 42 m cars). The lines come from
tools/streetcars/build.py, which reads each line as a list of street corners (from the
1925 plate of the city's early transit routes and the sources cited per line), finds each
corner in OpenStreetMap, and follows the streets between them, preferring the streets the two
corners name (any other street costs six times as much per meter). Two streets that meet
without sharing a node take their closest points, up to 150 m apart. A run over a viaduct
since torn down is drawn straight. The streetcar set's routes then run down the middle of a
street mapped today as two one-way carriageways (moved halfway to the other carriageway where one
of the same name runs the other way within 40 m), and are smoothed along their length (a Gaussian
10 m wide, the ends held), so a line does not step from one carriageway or one mapped way to the
next, and cuts each corner by about 6 m. A line is straightened to within 40% of its drawn width (at least 7 m), so a
traffic circle or a carriageway's sideways step on today's streets does not kink it, and its bends
are filled round. A route can also redraw a stretch of its line (patches: the stretch between
two points, the rest kept as placed): moved part of the way toward other mapped ways, or a set
distance to one side, both eased in over the stretch's first and last 20 to 30 m, then smoothed
wider and kept round (to 0.5 m) when the line is straightened. The Westhampton line on Three
Chopt Road runs halfway toward the frontage street beside it (the road and that street today
have a strip of ground between them, and the line's own right-of-way ran beside the road), smoothed
25 m wide; the Fulton line's descent on 31st Street is smoothed 15 m wide, and along
Williamsburg Avenue in front of the Armitage Manufacturing Company's building of 1900 it is moved
11 m to the south, onto the far carriageway and a little past it, so the line at three times
life size on the big map clears the building's wall (approximate). Where a line runs along a road bridge (within 6 m of its deck's
edge and within about 25° of its heading, beside the deck and not past its ends), it is drawn
on the deck as its track, 45% of its width on the ground (no wider than the deck; in the
streetcar set, at its full width on a deck widened to carry it), with a car on
the deck (one every 900 m, or one 45% of the way across a shorter bridge), and no car is set on
the ground under it. A road bridge
since taken down can be curated as a bridge line and is drawn as today's bridges are: the
low Free Bridge at Ninth Street (1878 to 1972), on which the Forest Hill cars crossed the
James, stands where the Manchester Bridge of 1973 does today, and the Marshall Street Viaduct (1911
to 1970) carries the Church Hill cars across Shockoe Valley, and the Ashland interurban's
half-mile concrete viaduct (1907 to 1938) carries its cars north from their terminal on Broad
Street. Vanished pleasure grounds (a fairground) take a sandy tint of
their own, and a racetrack is a closed dirt-colored ribbon. --streetcar-scale overrides the
series' scale for one build: the single-stop prints of the streetcar series use 1.5, so the
lines read thinner up close.
The fair grounds are traced from sheet 468 of the 1924–25 Sanborn atlas (100 feet to the inch, 0.403 m per pixel of the scan, north up, fixed at Hermitage Road and Sherwood Avenue): the outline follows the Boulevard and Hermitage Road to the tip where they meet, the one-mile track's south turn (a radius of 83 m) is taken off the sheet with its straights parallel to the Boulevard, and the north turn is drawn to make up the mile. Thirty-six of the fair's buildings come from the same sheet. A curated site (the fair grounds while the fair stood, a station's loop of tracks) clears today's streets, lots and buildings from within it.
One building, close up
Broad Street Station in 1943 is modeled from parts
(tools/stations/broad_street.py): wings, center pavilion, porch, six columns and two piers,
entablature, drum and a dome (a quarter circle in ten steps), each with a height above its
seat, and the concourse, a deck at the waiting room's level on piers over the tracks: a part
can stand at a given elevation and reach up to another, instead of rising from its seat. A part
can rest on another: the columns and piers stand on the porch and the entablature on the
columns, so on the sloping forecourt all six columns share one base and one top. The
station's own colors live in the palette's parts: limestone, the dome's tile, the iron and
roofing of the platform canopies, ramp houses, and the trains. Nine tracks follow the
surviving platforms through the station and the USGS quadrangles of 1934 and 1956 around the
loop, gathering into four and then two within 110 m of each end. Canopies are cut into 12 m
pieces, each on a column, 8 m wide and 5.4 m up; trains are a steam engine (18 m, with a
cab), its tender (11 m) and 26 m heavyweight cars, 1 m apart. At 1.5 pixels per meter or
closer, track is drawn with its ties and its two rails, 1.44 m apart. Each tie is a rectangle
on the ground, 2 m across the track and 0.25 m along it, square to the track where it stands
and spaced every 0.67 m along the whole line (the spacing carries on through bends), so it
foreshortens with the view like everything else; the strips paint the ties with the ground.
The rails are the center line offset 0.72 m each way on the ground, mitered at bends so they
have no gap or jog. Farther out, ties are a dashed line along the track.
A series can draw track wider than life (railScale, or --rail-scale for one build) and in
the ties' darker tone, so a network reads across a city: the wide railroad map uses four
times. Curated labels name places on the map; the single-place prints of a set leave them
out.
Cutaways
A cutaway opens one modeled building along a vertical plane (src/cutaway.ts,
src/cutaway-scene.ts). The region names the plane, a point and a compass bearing, and the side
of it that is lifted away; the camera stands on that side. Broad Street Station is cut down its
axis, the plane through the middle of the portico, the waiting room and the concourse, running
at a bearing of 40.8°, with the east half lifted away and the camera looking from that side at
a bearing of 342° (regions/broad-street-station-cutaway.json). Only modeled parts whose ids
begin with the region's prefix (bss-) are cut, and one canopy on the removed side that is not
cut is lifted away whole.
Every part of the building is first made into convex solids: a prism for a wall, a floor or a bench; for a dome, a solid of revolution in slices, one per side of its outline, with an outer and an inner surface; a stair as one block per tread. Each solid is clipped to the half of space behind the plane, and where the clip opens it a new face closes it on the plane: that face is the section, drawn solid in ink (poché). On the removed side the building is not simply gone: everything up to 1.5 m above its first floor stays, clipped there, so the ground floor reads as a plan, its walls cut low with inked tops, its benches and counters whole. A dashed line marks the footprint of what was lifted away, 1.5 m outside the floors, but only where nothing still stands: within 2.5 m of a low wall it would only repeat the wall, and is left out.
The pieces become ordinary items for the paint order (above). A part's pieces behind the plane are one item and its pieces in front another, and each is split again at the first floor, so it takes its place on both sides of the floor's slab. Within an item, faces turned away from the camera are dropped, the rest are painted far to near, and the sections last. A cutaway stacks many parts over others (slabs over piers, the concourse over trains), so its paint order adds one rule: two items apart on the ground, the farther wholly above the nearer, cannot cover each other and are left unordered; footprints that overlap by up to 3 cm, the rounding of their corners, count as apart. Cars and canopy runs are cut into pieces at most 7 m long, drawn without seams, so each piece takes its own place among the stairs and the deck it passes.
In a cutaway, coaches are solid Pullman-green bodies under a darker arched roof (or, for a
train in the C&O's colors of the early 1950s, livery: "co", blue with a yellow band along the
top of the side, gray below the windows and a dark roof), with a continuous band of windows down each side and, in the 1 m gap ahead of each car that has one
coupled ahead of it, the dark diaphragm of its vestibule. A steam engine faces the way its
train came in (the engine leads, toward the start of its line): a round boiler with a darker
smokebox at the front, a stack and two domes on top, a frame and running board under it, and a
boxy cab 4 m long at the back, beside the tender, whose tank is lower than the cab and carries
its coal heaped at the front. They are drawn in a grey light enough for their edges to show.
Sheds have butterfly roofs falling to a valley over their posts; a post stands only under a
roof that is drawn. The ground is flat-toned (the region's terrain.shade is 0, which turns
the hillshade off), and the dashed outline of what was lifted away lies level at the first
floor.
The flat section is made from the same parts and the same plane: the camera looks level and
square at the plane from the removed side, nothing in front of it is kept, and behind it the
building is drawn 35 m deep. Trains and sheds are not cut on the skew: where a track with a
train standing across the plane, or within 16 m behind it, meets the plane, one car is drawn
end on, square and true size on its trucks (a coach's arched end with its door, an engine's
round smokebox, or a tender's tank and coal); and where a shed's line meets it, its butterfly
profile, a center post and two wings rising outward. A stair down from the floor on the removed
side (to the platforms) is drawn as its stepped profile, dashed. Under it the ground is cut along the plane and dug out where the
building goes below it. Water held in a work (a forebay, a tailrace) and ground modeled as a
part (a canal's bed) are cut in their own colors, water's blue and the earth's, where every
other cut part is solid ink. A works that lifts water (the Pump House) may trace that water too, in a darker blue
beside the route of the water that drives it; drawn as water, the two are a pale band under a
thin line with arrowheads every 3 m, teal for the water that drives and blue for the water
pumped, never red, with a tag at each end saying where the water comes in and goes out. Platforms are drawn 0.35 m over the rails (approximate), rails at true
gauge where tracks cross the plane, and a red dashed line follows the traveler from the street
to the train. The line runs at waist height, 0.95 m over each floor, with a small arrowhead
pointing the way on each stretch, and it is broken where it meets a traveler and where it
would cross a car end seen square on, so it passes behind the car rather than over its face.
A cutaway may draw the same way through its travelers (cutaway.route: points with their
elevations, at waist height): it is cut into dashes as long, along the line on the screen, as
the section's, each dash an item in the paint order, so a wall or a floor in front of it hides
it. Its width and dashes are the section's times a weight, the section's scale on the sheet
over the cutaway's (0.52 for Main Street Station), so the two read alike there.
Travelers. A plain standing figure, 1.75 m (5 ft 9 in) tall, in the route's red, gives
the drawings their scale: head, body, legs in a short stride and a small suitcase
(src/traveler.ts). Its height is a convention, not a claim from a source. A place people
visited rather than passed through (the Pump House's pavilion) draws visitors instead, at the
same height: the figure with empty hands, or one in a long skirt to the ground (figure). In the flat section
four stand on the route, feet on their floors: on Broad Street, in the White Waiting Room, on
the concourse and at the foot of the stair beside the car end. In the cutaway three stand
upright, facing across the picture, on the portico, among the benches of the waiting room and
on a platform by the train; each is an item in the paint order like any other, with a 0.5 m
footprint, so what stands in front of it covers it. For Broad Street the section runs from 45 m on the street side of the plane's
point to 104 m on the track side, at 10 pixels to the meter, and its earth is cut 5 m below the
lowest ground along it. Code: src/section.ts.
What is approximate. Every part says how it is known: drawn (traced from a plate or a
survey map), written (placed from a written account) or approximate (inferred), and a
part that says nothing is approximate. For Broad Street Station the rooms of the first floor,
the hall's octagon, its benches and counters, the portico and the concourse's width are traced
from the first-floor plan of 1919 (Plate 15), fitted by the 240-ft frontage; the levels, the
dome and the basement are scaled from the sections (Plates 17 and 18), whose figures are
illegible; the first floor's elevation, wall thicknesses, door heights, the basement's piers
and use, the stairs to the platforms and the concourse's height are approximate. The sheet's
numbered badges show which: solid for drawn, a ring for written, a dashed ring for approximate.
Code: tools/stations/broad_street_plan.py, tools/cutaway/sheet.py.
Sources. For Broad Street Station: The American Architect of July 9, 1919 (its text, the first-floor plan on Plate 15 and the sections on Plates 17 and 18); the 1925 Sanborn fire-insurance atlas; the USGS Richmond quadrangles of 1934 and 1956, for the loop of tracks; the Official Guide timetables of 1933 and 1941 and the Richmond Railroad Museum, for the trains and where they went; the City Planning Commission's transit map of January 1943, for the streetcars and buses on West Broad; the ICC's 1955 ruling in NAACP v. St. Louis-San Francisco Ry., for the end of the segregated waiting rooms; and OpenStreetMap for the ground. Each is named on the sheet, and the wayfinding notes carry their own.
Main Street Station (regions/main-street-station-cutaway.json) is cut through its two
waiting rooms, the plane running at a bearing of 36.9° 4.7 m east of the front's middle (66.7 ft
from the west face on the plans of 1900), between the benches and the east row of columns, the
east side lifted away down to 1.5 m above the ground floor; the camera looks from the southeast
at a bearing of 325°. The rooms of the two public floors are traced from the plans printed in
The Railroad Gazette of July 13, 1900, their feet mapped onto OpenStreetMap's outline of the
head house. The concourse's roof and the roof over the taper to the shed are lifted away whole
(lift), each leaving its dashed outline. Its train shed is not cut: the roofing of
four bays on the shed's east slope, with the monitor's slatted side over them, is lifted away
whole instead, leaving the dashed outline of
its upper face where it was, so the trusses show on their columns. The shed is built from
frame parts, straight members in a vertical plane traced node by node from the cross section
of HAER VA-4 (sheet 3); a frame longer than 12 m is drawn in pieces of members 6 m apart across
it, so a train or a column under it sorts against the piece above it rather than the whole span.
The hipped roof of the head house is an inset shell, each side stepped in by the same distance
so its four slopes rise alike to the ridge, in courses about 1.4 m apart up the slope, and drawn
side by side in lengths of about 6 m, so a dormer sorts against the length of roof under it. Its
ridge, 41.4 m above sea level, and the tower's stages (the balcony at 35.9 m, the clocks' centers
at 40.3 m, the dome from 44.8 to 48.7 m, the finial's tip at 51.6 m, about 148 ft over Main
Street) are measured on HABS photographs VA-848-10 to -12 (1971) against the 102-ft front, to
within about 1.5 m. The roof's outline takes in the tower's, so a part marked over the shell
(the dormers, and the tower from its balcony up) is in front of every piece of it, apart on the
ground or not; a piece's box reaches up to the ridge, and beside the tower it would otherwise
stand in front of the clock stage. Parts inside the shell (within) sort against its pieces
first too, and a part over the shell is in front of a part inside it. The dormers are of two
kinds, each identical wherever it stands: pedimented wall dormers on the cornice over the
first, third and fifth bays, and small hipped dormers set into the slope, whose cheeks are
wedges cut by the roof's plane so they sit on the tiles; they are outlined in a finer ink
(ink: "fine", 0.35 against 0.6). The tower's drum and dome are sixteen-sided solids of
revolution. The
loggia's piers are stacked in courses about 0.55 m high, every other one set 3 cm proud, and its
segmental arches are plates in eight slices along the arc. Parts that stand inside the shell (within:
the offices in the roof) paint before the slopes that face the camera and after those that face
away; the floors and corridor walls in the roof are drawn in lengths of about 3 m along it, so
each sorts against the length of roof over it. The tracks stand on a deck at the level of the waiting room,
on trestles: a rail line with an elevation draws no ground ribbon, its train stands on the deck,
and its track is a modeled part with ties 2.6 m long, 0.67 m apart, and two rails at standard
gauge. Its flat section runs from 26 m on the Main Street side of the plane's point to 70 m on the
track side, the building 35 m deep behind it and everything else 26 m. The main stair, behind
the ticket office, is drawn there as its dashed outline (section.hidden); the shed is drawn in
full behind the plane, as HAER's longitudinal section draws it: the columns 18 ft apart, the
bracing between them, the underside of the roof falling to the eave, the monitor's slatted side
along the ridge, and the roof over the taper falling to the concourse; and a train standing beside the plane is drawn from the side, flat,
car by car, with its windows, doors, trucks and the gaps between the cars. Beside it the sheet
puts a second flat section, the shed cut across 1.2 m south of a truss and looking north
(regions/main-street-station-shed-section.json), at the same scale: the truss whole, the
platforms and deck in ink, the cars standing across the plane end on.
The sheet (cutaways/<name>.json, tools/cutaway/sheet.py) is 32 × 24 in at 300 dpi
(9,600 × 7,200 pixels): the cutaway large, the flat section beneath it, and a column of numbered
callouts, each anchored to a drawn part in either drawing, with the key, the sources and the
notes; a sheet may set a cross section (crossSection) beside the flat section, both at one
scale, and wayfinding labels under the plate that run past two lines push the sections down to
make room; a label may instead be set where the spec says (label), its leader leaving the
nearest point of its box. A sheet may frame the plate closer (isoView, a box in the plate's
own units), cutting what runs past it at the edge, and may say where its column must end
(columnEnd), to keep room for the title block; Main Street's ends by 6,560 of the 7,200, and
the Pump House's by 6,520, its spacing between callouts, groups and the key's rows tightened to
get there (column). A badge that would hide the part it names is set off it into clear space, with a thin
leader to a small dot on the part, drawn like the wayfinding labels' leaders. Callout text is 54 pixels (13 pt; 9.7 pt on the 24 × 18 in print), and the smallest text
on the sheet, the two-digit numbers in the badges on the drawings, is 40 pixels (9.6 pt; 7.2 pt
at 24 × 18). There are no canvas files: a canvas's 1.5 in of mirrored wrap would carry the
title and the column round its sides. Its title block sits in the bottom-right corner, below
the column.
Sets: a map framed by its places
tools/sets/set.py frames a big map with up to fourteen
numbered boxes (the 1925 streetcars use one per stop), each 1,800 m of ground across, cut from
the scene of its own year and rasterized from the vector at the pixels it fills, with a note
written from the sources stored beside it. The same tool makes the map alone, a print per box
(2,100 m across), canvas files with 1.5 in of mirrored wrap, and the box's page in the explorer.
isoscape locate tells it where each box falls in the picture. A set is one file,
sets/<name>.json; "Making a set" in the README walks through one.
Every window shows only the drawn plate: the part drawn edge to edge, measured without the slab's front face, so no paper and no tan band shows inside a frame; a box asked for more ground than that is drawn smaller to fit, and the big map is cut from the same part, moved up or down so every stop's marker stays inside. Every line of text is at least 7 pt at the smallest size each print is sold at (a 24 × 18 in stop print at 16 × 12, the 32 × 24 in sheet at 24 × 18, the 36 × 24 in map at 18 × 12, so 10.5, 9.3 and 14 pt on the files), lines are wrapped as evenly as they go so no word stands alone, and the corner the title block takes on any face cut from a file is kept clear. Markers that would overlap are moved apart with a short leader to their place; two-digit numbers are set smaller to fit their rings. A set's prints carry the dated series' ground note: the ground is today's, from lidar. Where several boxes share a place (four of Broad Street Station's), each marker can be set off it by a few marker widths, with its leader back, so the markers do not hide the place they name.
The Broad Street set's map adds a few rules of its own. Rail decks that cross pass at least 6 m
apart by their OSM layers, the lower one dipped toward the ground (keeping 3 m over it) and the
upper one lifted for what that cannot give, each change fading out at a 3% grade along its deck,
so the Triple Crossing reads at three levels. Streets are mended after the year's drops: a run of
up to 200 m left out between drawn streets for want of houses is put back, and a road that led
only to a later bridge, ramp or main road is left out with it, up to 250 m back from it, except
where a curated bridge of the year lands. Map labels carry a halo half their size wide over the
dense blocks, and rapids are drawn one stroke a cell. Main Street Station is drawn in massing
from the same measurements as its cutaway, its parts set from the ground under the station alone;
its roofs are hips and gables, its shed's on columns over the deck and trestle.
On the set's prints of single places, ink lines are held to 3 px at 300 dpi (a box cut close
from the big map otherwise drew them as heavy as it enlarged it); roads, paths and ballast are
filled round at every bend; tie marks go on one track only where tracks run within 5 m; a road
deck that carries a car line is laid on the line as drawn, so the line leaves it without a step;
and the big map draws yard and siding track at its own width, not four times it. The close view
of the station's front leaves out the cars and ramp houses under its shed roofs, and starts the
head house's wings at the mound's level along Broad Street (65.6 m), where the ground behind
falls about 5 m to the tracks.
Where two rail decks run into one another at nearly one level (within 2 m), the shorter deck's
pieces lying on the longer one are left out, so converging viaducts read as one deck.
A crossing's lift is carried on, still fading at 3%, into a deck that continues the lifted one end to
end, so no step shows where a line's OSM layer changes. Main Street Station's heights are measured
on three 1971 HABS photographs against the front's own width, 102 ft (approximate, to within
about 1.5 m): the cornice about 68 ft over Main Street, the ridge about 115 ft, the dome from about
127 to 140 ft and the finial about 148 ft, with a clock face about 9 ft across on each side of the
tower. Its hipped roof is drawn in two pieces round the tower, each cut from the one roof
(roofRing), so the ridge runs its measured 11 m.
What the series cannot show:
- Survivorship. Only buildings standing today are measured. Downtown Richmond in 1900 had far more buildings than the 1900 scene, because most of them were torn down later. The scenes show what survives, plus the few curated losses.
- Heaped years. Assessors often round: in this data, many buildings are dated to exactly 1900 or 1910. Read the decades loosely.
- Today's ground. The elevation is today's lidar, so the I-95 cut through Shockoe Valley is there in 1737. Curated water is laid flat at the lowest ground beneath it.
- The jump to today. Undated buildings appear only in today's scene, so the last step of a series adds many more buildings than really went up in that interval.
Code: src/history.ts; the history file is history/<series>.json; the tracing tools are in
tools/sanborn/ (Python: NumPy, SciPy, OpenCV, Shapely), and their output is
history/sanborn/.
Stages and inspection
Since November 18, 2026, every piece goes through four stages, and it moves on only when Chris passes it at a gate. A rough draft is a proof-size render. It tests whether the subject, the framing and the data can carry a print. A working draft is the full composition at print size, with its notes written and sourced and its known faults listed. Working drafts are numbered d1, d2 and so on. A final draft is a release candidate, numbered rc1, rc2. It gets one inspection against a fixed checklist, at most one round of fixes, and a recheck of only what changed. Final production is the stamped print, uploaded, for sale, with its release record written.
The inspection looks at the whole sheet at about 1,500 pixels across, roughly how a framed print looks from a meter away, and then in tiles of 1,200 pixels at full size. Every fact printed on the sheet is checked against the source it cites. Text must be at least 6 pt at the smallest size sold. What blocks release is what a person would notice at arm's length, and any fact that is wrong or unsourced. Faults seen only up close go on that print's list of accepted faults, so they are not reported again. A third round of fixes at any stage needs Chris's say-so.
Each file also carries an asset version, such as 3.1.0. The first number is the edition, and it is the only one the title block prints. The second is a correction made in place before anyone ordered that edition. The third is the same art stamped again. Drafts are named for the edition they lead to, such as 4.0.0-rc1. Once an edition has an order, it is never changed. The store's order counts (counts only) decide that, and a count that is not known counts as sold. Where everything stands is on the production board. This section was drafted with Claude.
Plates and the title block
Every print and canvas carries a small title block in its bottom-right corner, like the corner
of a drafting sheet: the isoscape cube, the maker, the piece's place in the catalog (collection,
set and piece), its plate number, version, the year it was drawn, the point the view was drawn
around and the direction it faces. On a 36 × 24 in sheet it is 1,690 × 239 pixels at 300 dpi,
about 5.6 × 0.8 in; smaller sheets scale it by the square root of their long side over 36 in
(so 4.6 in across on a 24 × 18), which keeps it legible. Its right edge lines up with the art,
and it sits as low as the art's side margin allows, with clear paper around it a third of its
height wide. Where the foot of a sheet is full (the two set sheets) it sits in the header
instead, and only if no place fits at full size is it shrunk, in steps of a tenth. On a canvas it
goes on the face, never the wrap. A piece that is not a map can say what it is in one more
line under the maker, at 28 units, about 7 pt on a 24 × 18 in sheet: the Broad Street cutaway's
says "Building cutaway". A long set name shrinks the collection › set › piece line to fit its
cell; a sheet can ask for a floor instead, and the Pump House cutaway's line, which would print
at under 5 pt on one line, goes on two at 6 pt on the 24 × 18 in print, every field kept. The
plates themselves are listed in catalog/plates.json.
Archive and explorer
Every build is kept under out/builds/<timestamp>-<name>/ as the SVG, a thumbnail and a
meta.json. The meta file records:
- the region's settings;
- the camera bearing used;
- every count the build measured (features, ground areas, buildings by height source, bridge spans, rapid cells, contour segments, strips);
- the build's time and file size;
- the git commit, its subject, and whether
src/orregions/had uncommitted changes; - an optional
--notesaying what the build was trying; - for a dated scene, its year, the year before it in the series, and the curated features drawn in it, with their sources.
backfill builds an older commit's code against today's cached data, so the archive can
include outputs from before it existed.
After every build, out/index.html is rewritten: this explorer. It is a single file with the
build list and these pages embedded in it, so it opens from disk with no server. The pages are
Markdown files in pages/. To add one, see the README. A page may number its pictures as
figures, each with a caption under it; clicking one opens it large in a lightbox, with the
page's other figures a step away and a grid of them all. The Jackson Ward story's views open at
3,200 pixels wide there, twice the 1,600 the page shows; its charts open at their own 1,600. A
figure can also be a compare slider: two pictures of one frame laid over each other, with the
same divider the explorer uses to compare two builds, dragged or moved with the arrow keys. Its
expand button opens the same slider large in the lightbox. The Jackson Ward year views are drawn
in one shared frame for this, so every year lines up with the others pixel for pixel.
Beside it go plain pages that need no script, for search engines and link previews: each of
these pages as p/<slug>.html, each map as m/<region>.html (and each year of a dated series
as m/<region>-<year>.html) with its picture and this same "How this view was made" text, and a
sitemap.xml listing them all.
Chat apps and social sites never see the part of an address after #, so every view in the
explorer would preview as the front page. Each map, each year of a series and each page also
has a share page in s/, named as its plain page is, with its own title, description and
picture, and a script that sends a visitor on into the explorer at that view. The Link
button copies a share page's address, and the address bar shows it while you look, so an
address copied from either previews as what you were looking at. The pictures are 1,200 × 630
pixels (1.91:1): a map cropped from its middle, saved as a JPEG at quality 86, about 140 to 260
KB; a page with a sheet of its own, such as a set or a cutaway, uses its drawing alone, not the
whole sheet.
Code: src/archive.ts, src/explorer.ts, src/pages.ts, src/story.ts, src/static-pages.ts.
Credits
Map data © OpenStreetMap contributors, available under the Open Database License. Elevation from the USGS 3D Elevation Program, public domain, and outside the US from the sources credited on Landmarks around the world. Years built for the Richmond series from the City of Richmond's open data. Fire-insurance maps from the Library of Congress Sanborn Maps Collection. Land cover, where a map uses it (Gwynn's Island), from the USGS National Land Cover Database 2021, public domain; building footprints OpenStreetMap lacks, where a map uses them, from Microsoft's Global ML Building Footprints, under the Open Database License. See About for what that means when you use or share a picture.
Each map names only the sources it drew from. A build works out its own credit line from what
the scene used (src/credits.ts): OpenStreetMap always; the elevation source by name when the
ground has relief; land cover when cover classes were read onto the ground; Microsoft's
footprints when at least one is drawn; assessor's year-built records when a date from them
decided whether a building stands in that year or is shown as new; Sanborn maps only when a
building traced from them is drawn. The line is written into the SVG (data-credits), the
build record and isoscape info, and the prints take it from the builds they are made from,
so a modern view never credits fire-insurance maps it does not use. A cutaway's sheet writes
its own credit line, so its scenes carry the sources only in their description, as sentences.
On a print, every line of the credit is at least 7 pt at the smallest size that print is sold
at: a 24 × 36 in file is also printed at 8 × 12 in, a third of its size, so there the credit is
set at 21 pt (88 px at 300 dpi) and wraps onto as many lines as it needs, between the title and
the title block. Where a long subtitle leaves too little room there (Gwynn's Island), the credit
runs instead on wide lines from the end of the title to the right edge of the map, above the
corner where the title block goes; the map itself is not moved or cropped.
Inspired by Isometric SF, Justin Chavez's isometric pixel-art map of San Francisco (how it was made).