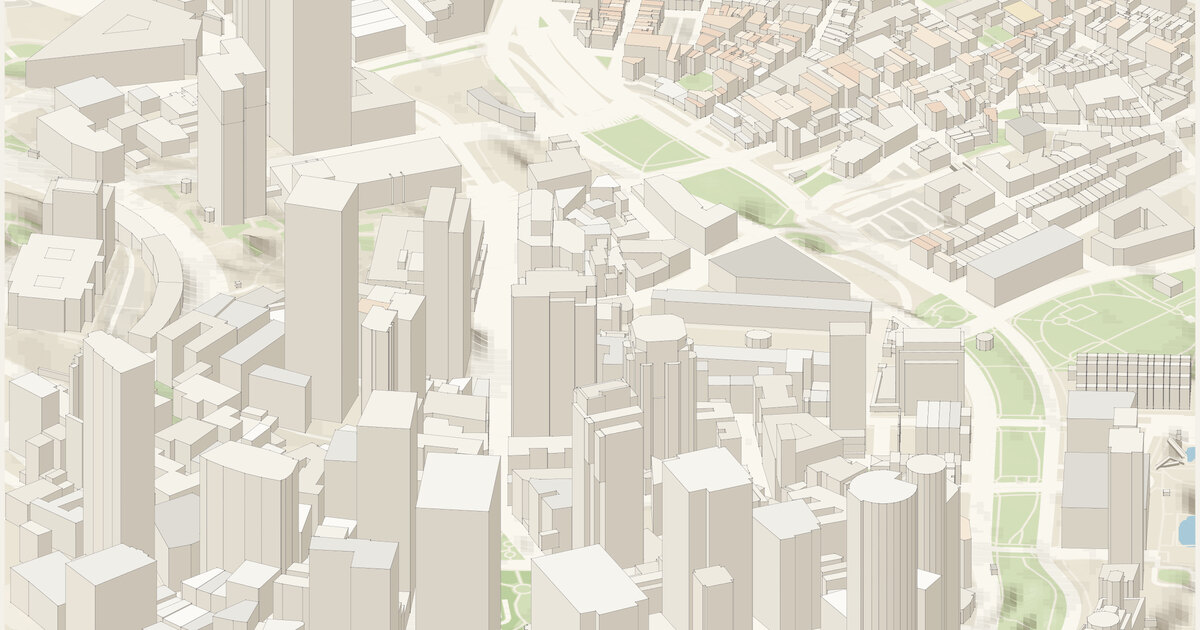
Faneuil Hall — Boston. A frame 900 m across and 1.17 km deep (1.05 km²), centered on 42.3600°N, 71.0562°W.
Camera how the camera works →
Looking north-northwest (bearing 346°), turned 13.6° counter-clockwise from the configured 0° so the street grid runs along the diagonals. Orthographic, tilted 30° down from the horizon: ground running into the picture is drawn at 0.5× its length and heights at 0.87×. 6.667 px per meter across the frame; the whole drawing is 6,048 × 4,431 px at 1:1.
Sources where the data comes from →
- OpenStreetMap: 7,373 features read from the cached download; the sea and tidal water come from 10 coastline ways.
- USGS 3DEP elevation (United States (U.S. Geological Survey); bare-earth lidar, 1 m across most of the US, served by the National Map), fetched at 2 m per pixel and resampled to a 5 m grid. The ground runs from -1.6 m to 25.1 m above sea level (26.7 m of relief), drawn 2× taller than life. Buildings and bridges keep their true heights.
Ground what the ground is made of →
From the map, 179 mapped areas of water, islands, parks, woods and other cover, and 2,116 ribbons of road, path, rail, canal and weir. Painted in 117 strips from back to front, 10 m deep each, so hills hide what is behind them (why). Contours every 2 m with every 5th line heavier: 5,320 segments.
Rivers and rapids how rapids are read →
No stretch of water read as rapids: places where the river’s surface, recovered from the lidar, falls faster than 0 m per 100 m, measured over 40 m. Rock standing more than 1 m clear of that surface is drawn as boulders. Both are inferred from the lidar, not observed.
Buildings where heights come from →
1,206 buildings, extruded from footprints of at least 12 m² that lie wholly inside the frame, from OpenStreetMap.
- 254 (21%) from a
heighttag - 554 (46%) from the number of floors, at 3.4 m a floor
- 398 (33%) guessed from the building’s type and size
Bridges how decks are placed →
15 bridge spans of up to 22 m, so long bridges sort among the buildings. Deck heights are rules of thumb: every bridge 7 m per OSM layer.
Drawing paint order →
The paper palette, a dot on every visible corner, on a ground slab 12 m thick.
This build the archive →
Built November 14, 2026 in 1.1 s, 2.54 MB of SVG. From commit f768bb1, “Launch prep: MIT license, map licenses, 'Make your own' README, shop links in the explorer”.
Map data © OpenStreetMap contributors (ODbL) · Elevation: USGS 3DEP (public domain) · credits and licenses