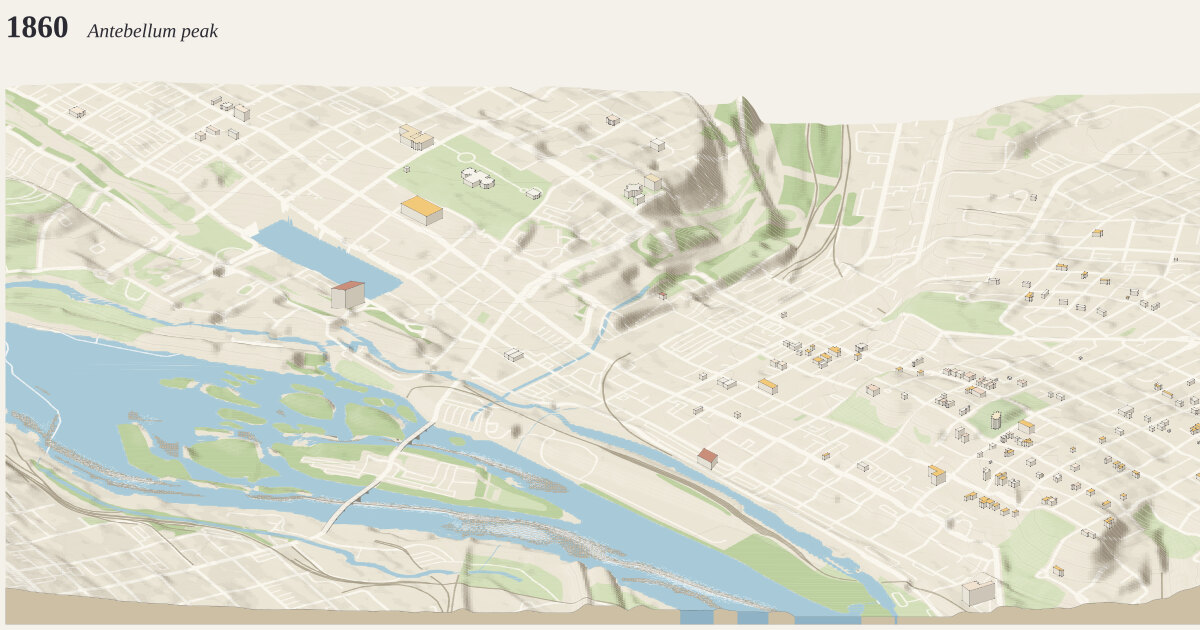
Downtown Richmond, from the Capitol to Tobacco Row, 1860. A frame 3 km across and 2 km deep (6.00 km²), centered on 37.5340°N, 77.4268°W.
The year 1860: Antebellum peak how time is drawn →
Richmond is among the South's most industrial cities, its flour mills among the largest in the world, and Shockoe Bottom the center of a slave trade that sends people south by the thousand.
Measured: 184 buildings standing today that had been built by 1860. Their years: 92 from the city assessor’s year built, 82 from OpenStreetMap’s start_date, 10 curated. 72 are new since 1850, roofed in gold. Anything demolished since is missing unless traced or curated below.
Curated for this year, from published sources; positions are drawn from today’s street grid and published dimensions, not surveyed:
- Great Turning Basin, James River & Kanawha Canal (1800–1895). The canal's Great Basin covered three blocks between Cary and Canal Streets, from 8th to 12th Street. Completed about 1800, and still drawn on the 1886 Sanborn map; later filled and used as a rail yard after the railroad took over the canal (the end date here is approximate). The James Center stands on the site. [1] [2] [3] [4]
- Libby Prison (warehouses, 1845–52; prison 1862–65) (1845–1889). Three brick warehouses, each 110 × 44 ft and four stories, on the east side of 20th Street between Cary and Dock. Used as a Confederate prison 1862–65; dismantled in 1889 and re-erected in Chicago. Footprint from the published dimensions, placed at the corner; not surveyed. [1]
- Gallego Mills, the great mill of 1854 (1855–1866). Twelve stories, 96 ft on Canal Street and 165 ft deep, at the southwest corner of 12th and Canal: by 1860 the largest building in Richmond and claimed as the largest flour mill in the world. Burned in the Evacuation Fire. Footprint from the published dimensions; position from the marker; height assumes about 3.3 m a story. [1] [2] [3]
- Lumpkin's Jail (slave-trading complex) (1835–1876). The largest of Richmond's slave jails, in the slave-trading district of Shockoe Bottom: a two-and-a-half-story brick building about 41 ft long, operated from the 1830s until 1865 and demolished by 1876. Its foundations were excavated in 2008 beside Main Street Station. Footprint approximate; position from the historical marker. [1] [2]
- Shockoe Creek (open stream) (1737–1877). The creek ran open between present-day 15th and 16th Streets, dividing the town, until it was enclosed in a culvert in 1877. Course approximated as midway between the two streets. [1]
The ground is today’s: cuts and fills since (the interstate, the floodwall) are in the elevation.
Camera how the camera works →
Looking north (bearing 351°), a fixed bearing with no snapping. Orthographic, tilted 30° down from the horizon: ground running into the picture is drawn at 0.5× its length and heights at 0.87×. 2 px per meter across the frame; the whole drawing is 6,048 × 2,643 px at 1:1.
Sources where the data comes from →
- OpenStreetMap: 7,217 features read from the cached download, shared with region
richmond-i195-rocketts. - USGS 3DEP elevation (United States (U.S. Geological Survey); bare-earth lidar, 1 m across most of the US, served by the National Map), fetched at 2 m per pixel and resampled to a 5 m grid. The ground runs from -0.1 m to 57.2 m above sea level (57.3 m of relief), drawn 2.5× taller than life. Buildings and bridges keep their true heights.
Ground what the ground is made of →
From the map, 208 mapped areas of water, islands, parks, woods and other cover, and 1,565 ribbons of road, path, rail, canal and weir. Painted in 200 strips from back to front, 10 m deep each, so hills hide what is behind them (why). Contours every 2 m with every 5th line heavier: 48,942 segments.
Rivers and rapids how rapids are read →
4,553 grid cells (about 11.4 ha) read as rapids: places where the river’s surface, recovered from the lidar, falls faster than 3.5 m per 100 m, measured over 40 m. Rock standing more than 1 m clear of that surface is drawn as boulders. Both are inferred from the lidar, not observed.
Buildings where heights come from →
184 buildings, extruded from footprints of at least 12 m² that lie wholly inside the frame, from OpenStreetMap.
- 2 (1%) from a
heighttag - 28 (15%) from the number of floors, at 3.4 m a floor
- 154 (84%) guessed from the building’s type and size
Bridges how decks are placed →
21 bridge spans of up to 22 m, so long bridges sort among the buildings. Deck heights are rules of thumb: Manchester 24 m, Mayo 6 m, Potterfield 3 m, and any other bridge 7 m per OSM layer.
Drawing paint order →
The paper palette, a dot on every visible corner, on a ground slab 18 m thick.
This build the archive →
Built November 14, 2026 in 1.0 s, 6.07 MB of SVG. From commit 8a9f63c, “Sanborn: drop sliver footprints and smooth outlines”.
Map data © OpenStreetMap contributors (ODbL) · Elevation: USGS 3DEP (public domain) · credits and licenses